Sunday, June 29, 2008

FHA Bill: "It’s not enough"

I talked about the FHA bill earlier but as it matures and grows as part of a bigger bill the fact that it just won't do very much is becoming clearer. From the NY Times:
“It’s not enough, even in the best of circumstances,” said Mark Zandi
..
Representative Barney Frank, Democrat of Massachusetts and a central force behind the legislation, said on Friday that recent reports about falling home prices have rallied support for the plan. But he acknowledged that the plan may not do enough to help homeowners or the housing market. Mr. Frank, chairman of the House Financial Services Committee, said that even after a bill like this, “you may need more.”

FHA qualifications, as loose as they are, are still very tight relative to the boom years. The number of people both able and willing to qualify is relatively small and the number of servicers willing to write down large portions of debt and risk their reputation and legal challenges with their investors is a huge unknown. I think the places where the servicer would voluntarily write down the loan amount such a large amount are parts of Florida, Detroit and Central California where the housing situation is extremely depressed. This would be a way for lenders to rid themselves of a large amount of low priced inventory very quickly. Since the costs of holding and selling are a much bigger percentage of the loan balance these low cost places with huge inventory overhangs will be the beneficiaries of this action. More expensive areas closer into cities (IMHO) will still go the traditional loan mod or foreclosure route.

There are other parts of the bill that are handouts (credits for buying homes) and bailouts (allowing more liberal tax write offs home builders and financial institutions) but the FHA portion of this bill isn't one of them.

Thursday, June 26, 2008

Updated San Fernando Valley sales

The SRAR has released the numbers for SFH and condos. SFH sales were up 6.36% Year-over-Year (YoY) and 22.3% Month-over-Month (MoM). After an unprecedented lull in sales the home sale activity is up almost double since January, except this is still the second worst May on record for SFH sales. Median prices for SFH were down 30.7% YoY and down 3.23% MoM. Clearly the smaller, cheaper homes are defining the market.

Pending sales were also released, they were flat from the previous month. The mix changed slightly though, SFH pendings dropped and Condo pendings rose. So we could be seeing the condo price drops finally moving the sales needle a bit.

Here are SFH sales & prices in historic context:


Here is SFH sales for May in historic context:


Condos are still showing an anemic spring selling season. Condo sales were down 32.8% YoY and up 15.0% MoM. Condo median prices fell 22.7% YoY and fell .33% MoM. Driving around the valley you see that their is a tremendous amount of infill and conversions waiting in the wings for the condo market, it clearly has much further to fall.


Here are Condo sales & prices in historic context:

Here is Condo sales for May in historic context:


Affordability is still the number one issue for the market. Either the market is going to have to get used to very slow sales and high prices or prices will come down further. With more foreclosures entering the market and short sales becoming more of a force as servicers get their act together and starting approving them faster I think it that prices will remain under pressure for some time.

Sunday, June 22, 2008

Harvard State of the Nations Housing Market to be released Monday

Tomorrow the following link should point to the 2008 version of "The State of the Nation's Housing 2008" by the Harvard Joint Center of Housing Studies.

Here is the Reuters preview:
Record foreclosures and limited access to credit will make it harder than usual to rebound from this U.S. housing market slump, the worst at least since World War Two, according to a Harvard University study on Monday.
...
"As investors demand a higher return for assumed risk and limit credit to riskier borrowers, costs are rising for all types of mortgage, consumer and corporate loans," the center said in a press release. "Many would-be borrowers are now finding it impossible to get loans at any price."
...
To get home affordability back to levels of 2000, before a five-year record home price and sales surge, "would take some combination of large price declines, interest rate reductions, rent deflation and unprecedented real income growth," the study said.
Even then, homes were out of reach for many "vulnerable households" often made up of low-wage workers, families with children and veterans.

What I think is amazing is that credit availability is still very good. FHA and the GSE have looser standards now then in 10 years ago. Credit is only tight relative to the banks giving away money to anyone who asked during the boom. But documenting income for loans and requiring a modicum of down payment requirement will ensure that prices return to levels commensurate with income. A return to affordability can only be had through price declines, interest rates are at their historic lows and won't be able to make up the difference between current prices and incomes.

Preliminary May 2008 San Fernando Valley Home sales charts

The SRAR has come out with some of their home reports for May but hasn't yet broke out the numbers specifically for Condo and SF homes. I estimated some preliminary number based on the percentage increase reported and MLS information. Home sales are up sequentially about 18% and condos about 16% if my calculations are correct. Year over year numbers should come in possibly 4% higher for home sales and about 32% down for condo sales.


Pending sales increased significantly for condos and dropped somewhat for SFH. It is clear prices are continuing to drop as the price discovery process is still in progress. Single Family Homes, in my estimation, have begun the inventory clearing process. This doesn't mean prices will stop dropping it means that prices have started to hit a point where some sellers with equity are deciding that they can't get enough for their home and choosing to stay and some buyers are deciding they are getting enough for their money to purchase. Condos have yet to start this process and it is clear the Valley has a serious issue in this area.


While I can't quantify it, I would guess gas prices are helping the Valley market at the cost of the Ventura market and Northern LA county markets (Palmdale/Lancaster, Santa Clarity Valley). You are starting to see sub-$300,000 single family homes on the Valley floor and I think that will steal demand from the outer areas.


I will post the official numbers when I get them but here are the charts I have based on the preliminary data I calculated (click to enlarge):


Thursday, June 19, 2008

Ventura County April 2008 to September 2006 downpayment size

Just a quick scatter chart to compare September 2006 with April 2008 to see how the down payment aspect of financing has changed.

April 2008:


September 2006:

(Click to enlarge)
Tremendous high-LTV & high-priced demand displayed during Ventura September 2006. For Ventura April 2008 you can really see the conforming limit putting a cap on prices. At 80% LTV most of the activity is at or below ~520k price (so under conforming limit loan) and you see the same effect at 90% (most sales under ~460k) and 95% LTV (most sales under ~440k). You see a lot of the April 2008 demand clustered under 500k and at or above 80% LTV. In September 2006 the demand is really concentrated on 100%, 90% and 80% LTVs and pretty well distributed across sales prices.

Tuesday, June 17, 2008

A look at downpayments in Ventura, April 2008

I pulled a set of records for April 2008 for Ventura county. It totaled 517 sales. Dataquick has 771 sales counted for Ventura so I have a subset of the data but large enough to be interesting.

Here is the loan to value ratio shown by quartiles:


1st Quartile - 68%
Median -
80.0
%
3rd Quartile -
90.0
%

I also broke it down by percentile:


Percentile - LTV
10% -
30.6
%
20% -
59.2
%
30% -
71.8
%
40% -
78
%
50% -
80
%
60% -
81
%
70% -
90
%
80% -
92
%
90% -
98
%

I'm still thinking of a good way to present the data so everyone can get a feel of what is required to buy a home these days. The high LTV loans were mostly cheap FHA or mid price VA loans (VA allows 100% financing) but there was a smattering conventional financing thrown in there.

Update: Here is a scatter graph (click to enlarge) I made of the data, the Y-Axis is the sale price the X-Axis is Loan to value. You get a feel for the higher LTV loans being at lower prices. There are some data points missing, the all cash and ultra low LTV, they represent about 8% of the data that is below 20% LTV, and there is a very few over $1 million properties missing.

Monday, June 16, 2008

Ventura County May 2008 Sales


The May 2008 Dataquick report is out. For Ventura County sales dropped Month over Month (MoM) and Year over Year (YoY). The month over month is a bit surprising as May is usually a prime selling month but at this point it could just be noise in the data. Sales were 708 which was a 17.8% drop from 861 sales a year before and 8.8% drop from the month before. The median price of $435,000 was 26.3 below last years $590,000.
This is a weak report for Ventura. Ventura is seeing a very weak seasonal pickup in sales and even the fact that the banks are somewhat motivated sellers (though not at liquidation levels) isn't helping bring the market back. Prices will continue to fall until an equilibrium point is reached and the market can clear inventory. Sales will improve once prices get to a point where available financing supports it.
Last year at this time Dataquick was talking about how the lack of available financing to subprime borrowers was keeping sales unnaturally low. Now they are talking about how the lack of jumbo financing is keeping sales low. It is all part of the same cycle, bubble type financing for the low end borrower failed first (skewing the median higher) and then the higher end bubble financing went away as well. Now we are starting to return to a normal lending market and prices will continue to adjust to that reality.

Sunday, June 15, 2008

Market Snapshot: Chatsworth. A look at what it takes to buy a home in todays market.

I took a look at two points in time (January, 2007 and April 2008) for Chatsworth, Ca to see how much financing a home has changed since last year.

I chose Chatsworth because it is small and so the data sets are easy to manage. And I have lived their before so I have local knowledge. I chose those two points in time because January 2007 was right before the subprime blowup and April 2008 was the last full month of public record data I had.

Chatsworth January 2007
100% financing - 17
95% - x - 100% - 3
90% - x - 95% - 6
85% - x - 90% - 1
80% - x - 85% - 3
75% - x - 80% - 0
0% - x - 75% - 5
All Cash - 1


Chatsworth April 2008
100% financing - 0
95% - x - 100% - 1
90% - x - 95% - 11
85% - x - 90% - 1
80% - x - 85% - 4
75% - x - 80% -
3
0% - x - 75% - 3
All Cash - 0


Note: There was one house in April which didn't have a listed sales price because it was new construction. I put it in the 90% bucket based on the tax data. Excuse the formatting, blogger doesn't like tables for some reason.

Small data set, but it appears if you want to buy in todays market you need to come in with a good sized down payment. Based on the lowered sales in April it is likely that many people are simply not qualifying either because of lack of down payment or lack of income relative to the purchase price of the home. The one high LTV loan in April was a FHA loan. The 90% to 95% bucket in April consisted of eight 10% down, two 8% down and the one unknown. The median for January '07 was $564,000 for April 2008 was $430,000.

It will be interesting to see how many buyers are on the sidelines with significant down payments if it isn't a lot then prices will have much further to fall.

The other thing I thought was interesting in looking at Chatsworth and surrounding closed sales was the "deals". The REOs and Short Sales were in general sold from 90% to 106% of list price (not Original List Price). So the banks were willing to deal somewhat on list price on inventory listed on the MLS but when they priced aggressive they got overbids. There were a couple of non-MLS transactions which looked to be significant discounts to list price but they were not the norm. The banks have a process to find market price and it appears to be working.

Updated SoCal MLS Stats

SoCal MLS updated their closed homes for May. Closings are around 2538 and Condo sales are 772. I would have been shocked if the initial reported numbers (which were down sequentially) held up. If the tales of the REOs being motivated sellers were true we should see increased sales from the historic lows we saw the first 4 months of the year.


Saturday, June 14, 2008

CAR 2008 updated forecast, Round 3

Original:
Updated in April 2008:

Updated in June 2008:

(Click to enlarge)

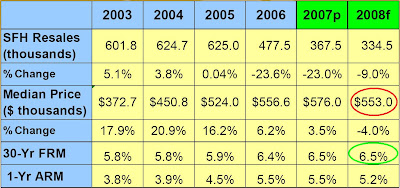
In 2 months the forecast increased sales by 3%, decreased median price by 5% and is predicting lower 30yr fixed rates.

Friday, June 13, 2008

Aggressive loan mod, the future of severely depressed markets?

This thread on Broker Outpost caught my eye:
The borrower is upside down in the property and just wants to walk away. Foreclosure has been in the works and should meet the steps of the court house soon, until....
My borrower received a FED-EX package from Countrywide. Countrywide sent a loan modification writing the second mortgage off and reducing the first mortgage. The new loan is a 4.5% Interest Rate for 40years and the borrower does not have any payments until July 1st. His new payment is now reduced a total of $1,000.00 making his payment affordable.

Why would this happen? The second could easily just given up or the mortgage insurer come to a deal with the second (some seconds bought insurance protection) in the recognition that the second lien is now worthless. The first might do this willingly, but I think a more likely scenario is the first just sold the note and someone probably bought a non-performing note for 50-60 cents on the dollar. Throw in a 40 yr amortization and they have a pretty good note if it performs.

Here is the simplistic math, I'm just going to do Interest Only to make things simple.
$100,000 total = $80,000 first , $20,000 second
If the borrower has a blended rate of 7% that would be $7000 a year.
Second goes to zero. First gets sold for 50 cents on the dollar ($40,000) new rate is 4.5% * $80,000 = $3,600. That is a 9% note to the new holder. Borrower gets a deal, new note holder gets a deal, original lenders liquidates and moves on.

I don't think the lenders are doing this out of generosity or compassion, there are places with severe oversupply like parts of Florida, Arizona and central California that will take decades to resemble normal housing markets. Once the foreclosure values start getting near what they can get for the notes on the secondary, things like this will happen.
Penny Mac is a company organizing to buy non-performing loans cheap, get them performing and then sell them off. At some point I don't the moral hazard aspect (if borrowers starting hearing the lenders are giving out a deal they'll start defaulting) even is a factor if prices have fallen far enough.

Tuesday, June 10, 2008

Foreclosures.com calling bottom..


"“The numbers support what I’ve been saying for a while – the housing market is not as bad as what you hear,” says Alexis McGee, foreclosure information expert, educator, and president of ForeclosureS.com.The market is showing signs of forming a bottom as supply catches up with demand because fewer new homes are being built and buyers are flocking back into a much more affordable market. Yes there are tons of foreclosures glutting our inventory, but foreclosures are not increasing as many believe. And for the many homeowners who have already defaulted, efforts by government and industry helping homeowners work out their mortgage problems appear to be paying off,” " from their press release.
Here are what their local area numbers look like for Los Angeles and Ventura County. Click to enlarge any graphics.

Preforeclosures (I assume just NOD, they do not specify in their report):


REO broken out by month.


REO year to date. I have no idea how they got 71% increase from the numbers below.


There was a spike in March and 2 months that didn't match that spike after. Apparently that is turning a corner.

IMHO, LA/Ventura joined the bubble burst later than other bubble parts of the country like Florida, Arizona and Nevada. And other parts of the state like Central California, San Bernandino and Riverside. I think the places that broke down sooner will hit a bottom sooner. In LA/Ventura I think we have much further to go.

An example would be that the inventory that has been foreclosed is slow to reach market and lenders are overwhelmed dealing with the sales activity along with the preforeclosure and newly foreclosed homes. Anecdotal evidence of this can be seen by broker Jim Klinge in San Diego:

"Since the end of April when I had 20 properties sent to me, only three have made it to market. Another one got rescinded (stand-by, this one will be a story in itself) and three others have extenuating circumstances why they have stalled. But literally the other 13 are sitting vacant, waiting for Countrywide's asset managers to give me the green light to put them on the market."

I think calling a bottom is premature for the foreclosure issue, especially in our local area. Sales for 2008 may be the bottom, I could see making a case for that since prices are dropping. But dropping prices will exacerbate the foreclosure problem not ameliorate it.

Monday, June 9, 2008

May 2008 SoCal MLS sales.

The SoCal MLS, which covers only a small portion of Southern California, has published May sales on its website:


Single family home sales down sequentially, which would mean down year over year as well.

As I
reported for the SFV in April the condo market is not seeing any rebound, seasonal or otherwise. This continues on in the May SoCal MLS numbers:


If these numbers hold up in the same ratio to Dataquick reported numbers then we might see more homes foreclosed than sold in May 2008. But it is possible that the areas not covered in the SoCal MLS, which encompass more outer and low cost areas, are having a bigger boon in sales due to the foreclosure effect.

It is also possible that the SoCal MLS isn't done reporting sales and some late reporters could boost the numbers.

Sunday, June 8, 2008

May 2008 Los Angeles County foreclosure statistics

Property Shark released their May foreclosure report:


Trustee sales were up 17% MoM and 232% YoY to 5,308. To put that in perspective, in April 2008 there were 5,016 non-Trustee sales in all of Los Angeles County. If May sales numbers don't increase sequentially by about 6% there will be more homes foreclosed on than sold in Los Angeles County.

Sales are still abnormally low, it is clear prices will have to continue fall to clear out this excess inventory that is building.

Countrywide rumor featured in NMN.

Countrywide is a big part of the local economy, Paul Muolo of the National Mortgage News suggest changes are coming after the Bank of America merger is completed (emphasis added):

So, what's going on with Bank of America's purchase of Countrywide Financial Corporation? We understand that BoA has a three-pronged approach to the merger, calling each milestone a "tollgate." The first tollgate was to assess how CFC conducts business in its different departments and units. The second tollgate involves realigning CFC to how BoA is organized. The third tollgate: Matching up the departments and eliminating redundancies and ways of business that BoA does not like. From what we've been told the CFC/BoA mortgage "brain trust" will remain in Calabasas but certain offices and divisions might be closed. BoA has yet to disclose details. One source suggested that the merger actually might be completed early in the third quarter.


If any major operations are moved from Ventura it will have a dramatic effect. These are good paying jobs and Ventura's economy isn't very diversified.

Friday, June 6, 2008

California and foreclosure

The Mortgage Banker Association released their National Delinquency Survey today. It is showing record activity concentrated in the bubble states and prime and subprime ARMs as represented in this WSJ graph:


The MBA breaks down prime versus subprime by FICO score instead of by loan type so you get a lot of what I would term "subprime products" (stated income, hybrid ARMs, option ARMS) in the Prime ARM category.

The following quote from MBA research chief to the Money & Co. blog on LA Times caught my eye:
"But Jay Brinkmann, research chief at the mortgage bankers' group, says the problem in California is that delinquent loans have less of a chance of being cured than in other parts of the country because of the severity of the home price declines here. In other words, delinquencies are more likely to turn into foreclosures in the Golden State."

Dataquick mentions this phenomenon in their quarterly foreclosure reports as well. The number of homes entering the first steps of the foreclosure process and able to prevent foreclosure has been steadily decreasing. Here is the how much this statistic has deteriorated over the past few years:


As the homes get underwater it becomes less likely they can be saved by alternate means.

Wednesday, June 4, 2008

San Fernando Valley Foreclosures heading towards a record

From the Daily News (emphasis added):


..During April, 608 families lost a home to foreclosure, up from 202 a year earlier and 511 in March..

The glut of homes on the market pushed the price of a median single-family home down to $505,000, a loss of 21 percent, or $125,000, from the year-earlier price, the report said. It was up by $5,000, however, from a month earlier.
...
With notices of default - the first step in the foreclosure process - increasing from 663 in April 2007 to 1,560 a year later, there's no indication the housing slump will end anytime soon, the center said.
...
During April, 964 new and previously owned houses and condos were sold, down 29 percent from a year earlier. It's the lowest sales total for an April since DataQuick began tracking the market in 1988, Blake said.

With 608 foreclosures to 964 sales that means for every 3 homes sold almost 2 were foreclosures were replacing them on the market. This is ignoring newly listed short sales, newly built homes and condos or just an existing homeowner putting their home on the market to sell. It is clear the housing correction will be a long and deep one. The only thing that will reduce the length would be prices dropping to a level that people who don't currently own homes can qualify under todays new tighter lending standards.

But when the SRAR looks at the sales statistics for April here is what they say:


"But multiple factors argue against steep declines in single-family home prices:” Link said, “pent-up demand, an inventory that offers a good selection yet is not excessive, assistance for some beleaguered home owners that will keep more homes off the market.."

“Anyone interested in buying a home who is waiting for prices to fall off a cliff most likely will miss what may well be a small window of opportunity to get into the market,” Link said.

Trust is needed for buyers to come into the market. Trust that they aren't being sold a line in order to make a sale and are getting the straight scoop on the market. These comments are not building trust. Hopefully the SRAR will learn to craft their message to reflect the market accurately and let people know that when they decide to buy or sell they know who to call.

Tomorrow the Mortgage Bankers Association reports national delinquency numbers we should be in for a new record.

Sunday, June 1, 2008

How big of a deal is the Fannie Mae and MI changes?

I'm trying to predict how big of a change Fannie Mae underwriting changes will have on the housing market. They seemingly loosened up a bit with the dropping of the declining market policy which required 5% more down in a market deemed declining. But the mortgage insurers (MI) have tightened on June 1st as well, increasing fees and decreasing LTV and loan amounts for restricted markets.

I think the most important lines in the Fannie announcement were:
No longer consider the existence of mortgage insurance as a mitigating risk factor when evaluating higher-LTV loans, most notably for the purchase of a one-unit property that will be the borrower’s principal residence.

If they are no longer considering mortgage insurance as a mitigating risk factor this suggest that anything over 80% LTV is going to be very conservatively underwritten. Fannie had been handing out a lot of document waivers, not requiring a full documentation on a full documentation file I would venture to guess that bit would go away. I am guessing they are also doing this to basically say they aren't relying on the MI underwriting anymore or, as we have seen in recent weeks, the very real possibility of a MI company going under.

With this release, the maximum allowable total expense ratio in DU will be updated to take into account certain risk factors contained within the loan casefile. In general, the updates to the maximum allowable total expense ratio in DU Version 7.0 will be more conservative than in previous versions of DU.


The speculation I have seen is that the max DTI has gone from 65% to 55%. Still insanely high if you think about it but a tightening regardless. The MI companies that I have seen generally top out at 45% DTI so for high LTV loans this may be a moot point.

Reduced Approve and/or EA recommendation rates, although the overall impact will vary depending on the mix of business the customer submits to DU.

They are saying that fewer loans will be approved but not quantifying the change.


Here is an example MI change, this was the loosest (as far as max LTV) insurer I saw when looking around:


The top portion is the new matrix for restricted markets, the bottom is the old. The loan amounts for the lowest down payment has dropped $283,000 to $417,000, the credit score dropped from 700 to 680 and they only allow a single unit property at this level. The 10% down payment for a single unit had its credit score raised from 620 to 700.


Holden Lewis found this comment from Fannie's CFO:
Fannie's chief financial officer, Stephen Swad, told investors this month that "we have significantly tightened underwriting and eligibility standards." That trend continues with DU 7.0, which will make a lot of small changes that could add up to something substantial. Or, as Fannie phrased it in a notice to loan officers and brokers,"DU Version 7.0 will include a comprehensive update to DU's credit risk assessment" that will result in fewer loan approvals.

If this change does significantly impact closings we will start seeing it in the July numbers that come out in August. By perusing the broker boards you should be able to tell if it is having an impact on the market before then.