*taps microphone*
Hello? Is this thing on?
Long time no talk! After over 10 years it is safe to say I made the right decision on purchasing a home, it has been nothing but a home run from a numbers point of view. I was extremely conservative in future appreciation and rent increases and the markets have long ago moved past my benchmarks.
I keep light tabs on the market and I said in a comment to my last post almost 8 years ago that it is going to suck to be a buyer for a long time and it has only gotten worse. Inventory is just terrible and prices keep rising and there doesn't really look to be hope on the horizon for waiting out the market. Last years rate cut combined with COVID-19 work from home has unleashed almost universal demand. It will take builders in many land constrained areas a very long time to catch up. Builders in areas with available land are just printing money right now.
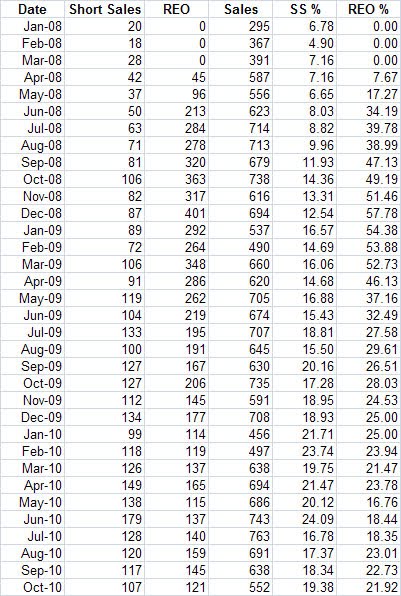
I talked to someone recently hoping for a foreclosure tsunami.. yes, that 13 year old tale that foreclosures would come in and save the buyers from the terrible choice they are faced with. It didn't happen 13 years ago with almost perfect conditions.. it certainly isn't happening anytime soon in California. The accounting rules have changed dramatically to make servicers want to work with homeowners over foreclosing.. the laws have changed making it take longer to foreclose and thus more costly. There is no impetus to foreclose in large numbers in California. It simply will not happen.
I wish the 2-3 readers who might still be subscribed all the best and hope this information is absolutely useless to you.