Tuesday, October 19, 2010

Ventura County September 2010 Home Sales


Dataquick reported home sales for Ventura County for August 2010 today. Home sales came in at 682 down 13.0% YoY and down 5.1% MoM. The median sales price came in at $370,000 down 0.5% YoY and flat MoM. I noted in my early month estimate that my normal model predicted sales of 700-720 but due to changes in the underlying data used for estimates I thought closings would come in lower and that was what in fact happened. Currently October is running at 20% below September closings month to date so this horrible performance is continuing. To put these numbers in perspective the last time numbers were worse, 2007. Countrywide had just imploded and all that was left was FHA (which few were equipped to underwrite at a large scale) and the GSE's had a $417,000 limit. Additionally prices were much higher as were interest rates so the gap between buyers and sellers was much much wider. But right now we have a $729,000 loan limit, 4% mortgage rates and lower prices and sales are anemic. Prices are still too high.

Friday, October 1, 2010

Short Sale & Foreclosure for Ventura County - September 2010


Here are the sales for Ventura County September 2010. We are at levels which suggest flat to down sales from August but there is one caveat. The underlying data source has been undergoing some changes and I don't know how that will effect these numbers (there is more of a possibility of double counting now). So there is a possibility the numbers could come in a bit weaker than my call of 700-720 for the Dataquick Ventura sales number but I wouldn't think it would be dramatically lower (nothing lower than 650). I just don't have enough data at this point to know how the changes will effect my normal guesstimate.

Thursday, September 30, 2010

Short Sale & Foreclosures for the San Fernando Valley - September 2010


Here is the sales breakdown for the San Fernando Valley for September 2010. The SFV has a lot more late reporters as a percentage of sales and so it is a bit tougher to discern right now just how weak sales will ultimately be for September. But, it appears that sales should be at the same levels as August perhaps slightly weaker.

Wednesday, September 22, 2010

San Fernando Valley home sales report - August 2010


San Fernando Valley Single Family Home sales for August 2010 came in at 539 which is down 8.49% MoM and down 19.55% YoY. This is the eleventh straight month of YoY declines and the WORST August on record for Single Family Home sales. The median price for single family homes came in at $400,000 which is up 0.25% MoM and down 2.83% YoY. Residential inventory is up YoY and growing. The market is completed stagnated, the administration is keeping the motivated inventory generally off the market and there is no market clearing event so sales and buyers choices will continue to be horrible going forward. New pendings last month were at levels suggesting September will come in at August levels.


Condo sales came in at 208 which is down 3.70% MoM and down 9.56% YoY. Median price for condos came in at $230,000 which is down 4.54% MoM and eevn YoY. The only strength in the market is in the condo space and I think that is due more to the amount of motivated supply (whole condo projects going defunct). Condo pendings aren't strong going forward and are at levels suggesting that September sales will look very much like August.
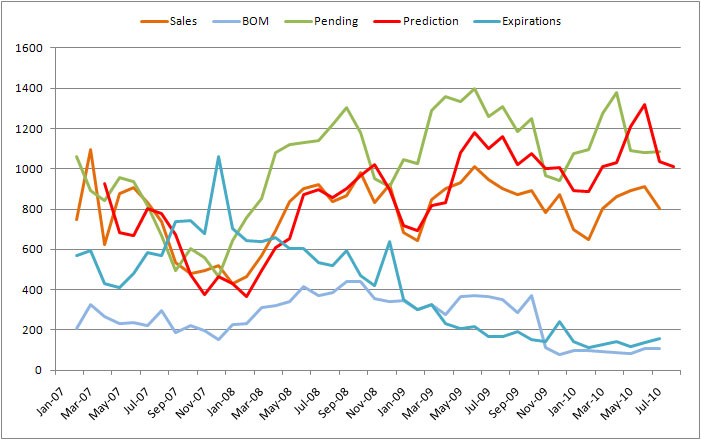
Based on August pendings (green line) the predictor (red line) suggest stagnant sales for September.

Tuesday, September 14, 2010

Ventura County August 2010 Home Sales


Dataquick reported home sales for Ventura County for August 2010 today. Home sales came in at 719 down 9.7% YoY and down 4.0% MoM. The median sales price came in at $370,000 down 1.5% YoY and flat MoM. Volume was lower from what I predicted at the beginning of the month. The anemic volume continues and looking forward to the weekly inventory pending and contingents it doesn't look like the malaise will end anytime soon. Prices will continue under pressure as a result.


Thursday, September 2, 2010

Short Sale & Foreclosure for Ventura County - August 2010


Here are the sales for Ventura County August 2010. Sales are still very low, with late reporters I expect the official Dataquick numbers will be down YoY at around 750 sales. This continued stagnation in the market is the same boring story, less supply due to government intervention trying to keep prices high at all costs. Watching the weekly inventory reports for Ventura County you can see supply building but contingents and pendings have stopped falling rapidly due to continued price cuts by sellers. If Dataquick sales do come in around 750 that would be the worst August since in at least a decade (the period for which I have data).

Short Sale & Foreclosures for the San Fernando Valley - August 2010


Here is the sales breakdown for the San Fernando Valley for August 2010. The SFV has a lot more late reporters as a percentage of sales and so it is a bit tougher to discern right now just how weak sales will ultimately be for August. But, it appears that sales should be at "weakest August on record" levels. I doubt you will hear that spin in the local association press release.

Saturday, August 21, 2010

San Fernando Valley home sales report - July 2010


San Fernando Valley Single Family Home sales for July 2010 came in at 589 which is down 9.24% MoM and down 20.94% YoY. This is the tenth straight month of YoY declines and the WORST July on record for Single Family Home sales. The median price for single family homes came in at $399,000 which is up 3.64% MoM and down 0.25% YoY. Residential inventory is officially up YoY but inventory is still light. The market is completed stagnated, the administration is keeping the motivated inventory generally off the market and there is no market clearing event so sales and buyers choices will continue to be horrible going forward. New pendings last month were at levels suggesting August will come in at or slightly below July which would make for the worst August on record.


Condo sales came in at 216 which is down 17.56% MoM and up 6.40% YoY. Median price for condos came in at $220,000 which is down 4.34% MoM and down 3.50% YoY. The only strength in the market is in the condo space and I think that is due more to the amount of motivated supply (whole condo projects going defunct). Condo pendings aren't strong going forward and are at levels suggesting that August sales will look very much like July.


Based on July pendings (green line) the predictor (red line) suggest slightly lower sales for August.

I predict the NAR will be going hat in hand to Congress for another tax credit soon (probably after the elections). With sales this bad they will try to get another handout.

Tuesday, August 17, 2010

Ventura County July 2010 Home Sales


Dataquick reported home sales for Ventura County for July 2010 today. Home sales came in at 749 down 10.5% YoY and down 15.8% MoM. The median sales price came in at $370,000 down 5.20% YoY and 3.6% MoM. Volume was in range from what I predicted at the beginning of the month. This amounts to the worst July since back for when I have records as far as sales volume. Right now August is looking weaker but with closings weighted towards the end of the month anything can happen. I highly doubt we'd see even July level volume in August though. If you follow the weekly inventory reports for Ventura County you can see the contingents have fallen but then leveled out as sellers respond with price cuts. It looks like a long slow slog from here on out.

Thursday, August 5, 2010

Ventura County Loan To Value Chart - January through June 2010

Note: The above chart can be clicked on and enlarged.

I haven't posted the loan to value charts in awhile. This one is for the period between January 2010 and June 2010.

The chart is simply purchase price on the left with loan to value ratio across the bottom. The different color coding indicates the type of loan (Conventional, FHA, Private Party or VA).

You can really see various underwriting guidelines come into play. That arching blue line going from top left sloping down right is the effect of the conforming loan limit on the conventional market. The solid line at 80% LTV is the effect of traditional underwriting guidelines with no Mortgage insurance. At 75% LTV that line usually indicates 2nd home purchases and the like. The blue line at 90% LTV most likely shows conventional loans with mortgage insurance. Then there is of course the absolutely massive wall of FHA financed properties.

I think the high LTV FHA high balance FHA loans are extremely risky. These are people who can't save and have high consumption. Their prospect for higher income is low but lower income is high and it isn't like they have shown a propensity for saving for a rainy day. Also FHA loans are underwritten to extremely high DTI ratios (as high as 47% front and 57% back end).

Wednesday, August 4, 2010

California Shadow Inventory Report - Q2 - 2010

There was a point in time where various housing bloggers were talking about "shadow inventory" as houses taken back by the bank and purposely kept off the market. According to these bloggers this horde was supposed to be released en masse and flood the market. It was a great, sexy story and I never saw any making much effort to prove or disprove if it was actually happening. Since trustee sales are a matter of public record I went and matched up all trustee's deeds that never made it to the MLS and it turned out to be a trivial sum when you accounted for turnaround time for eviction, trashout, bpo's, and all the other stuff that happens before the houses hit the market. This data was not well received by those bloggers espousing that version of the shadow inventory opinion but they have since changed their tone to the "other" version of shadow inventory. The other housing bloggers talk about "shadow inventory" in the terms of number of delinquent borrowers... this is a very very large number. But in terms of houses foreclosed but not on the market, it is very small. In short, If there is going to be a tsunami that floods the market it will be trivial to see coming before it hits.


This is a simple graph to show the accumulation (or lack thereof) of REO inventory. When the blue line is above the green line REO inventory could be accumulating. I say "could be" because the green line is merely the number of homes sold during the quarter that were foreclosed in the past 12 months, so investors trustee flips would be captured in the data as well. I think the blue line will elevate somewhat but the two lines will stay pretty close as it makes little sense to foreclose and not market the home.

I am very doubtful of the tsunami theory simply because the government has said it is not what they wish to happen and they have gone to great lengths for it not to happen. What we will have instead is stagnation in the market for a very very long time.

As you can see with the above graph, there was no great accumulation of REO's during Q2.

Monday, August 2, 2010

Short Sale & Foreclosure for Ventura County - July 2010


Here are the sales for Ventura County for July 2010. Sales are still very low, with late reporters I expect the official Dataquick numbers will be down 10-15% at around 730 sales. This continued stagnation in the market is the same boring story, less supply due to government intervention trying to keep prices high at all costs. Watching the weekly inventory reports for Ventura County you can see supply building but contingents and pendings have stopped falling rapidly due to continued price cuts by sellers. The current level of demand is still extremely low reminiscent of January/February demand levels but when the sellers get the price right the homes fly off the market.

Short Sale & Foreclosures for the San Fernando Valley - July 2010


Here is the sales breakdown for the San Fernando Valley for July 2010. The SFV has a lot more late reporters as a percentage of sales and so it is a bit tougher to discern right now just how weak sales will ultimately be for July. It appears that sales should be down 10-15% YoY when all the late reporters are counted. These sales levels are extremely weak historically.

Friday, July 30, 2010

Weekly inventory charts are back up

A week and a half ago google broke their charting widgets. They just got them running again today and I republished last weeks results. Please let me know if you are experiencing any issues with the weekly inventory charts.

Tuesday, July 27, 2010

San Fernando Valley home sales report - June 2010


San Fernando Valley Single Family Home sales for June 2010 came in at 649 which is down 4.42% MoM and down 16.26% YoY. This is the ninth straight month of YoY declines and the WORST June on record. The median price for single family homes came in at $385,000 which is even MoM and up 2.67% YoY. Residential inventory is officialy up YoY. New pendings last month dropped below June 2008 (which was worse than 2009) levels.


Condo sales came in at 262 which is up 23.00% MoM and up 11.01% YoY. Median price for condos came in at $230,000 which is down 1.29% MoM and up 1.77% YoY. This was the best month for condo sales since July 2007. Clearly the larger condo supply and tax credit deadline had people choosing condos over SFH in a desperate attempt to get the tax credit. The only strength in the market is in the condo space and I think that is due more to the amount of motivated supply (whole condo projects going defunct). Condo pendings aren't strong going forward but they are doing much better than SFH.

Based on pendings (the top green line) we should see a lower closed sale for July but considering how muted June was I think we very well could see even lower sales as back on market properties stay on market instead of being sold again.

Thursday, July 15, 2010

Ventura County June 2010 Home Sales


Dataquick reported home sales for Ventura County for June 2010 today. Home sales came in at 890 up 5.5% YoY. The median sales price came in at $384,000 up 5.20% YoY. Volume was stronger than I predicted at the beginning of the month, late reporters as a percentage of sales was much greater than normal. The possibility of the tax credit running out really caused quite a rush in closings. Rising median is due to mix shift due to the low end running out of inventory the most plus some seasonal strength in the mid-level houses as those sellers have been cutting price to compete for buyers. As far as sales volume this was the high water mark for the year, the question is just how far we fall from here.

Monday, July 5, 2010

Short Sale & Foreclosure for Ventura County - June 2010


Here are the sales for Ventura County for June 2010. Sales are still very low, with late reporters I expect the official Dataquick numbers will be about even at around 840 sales. This continued stagnation in the market is the same boring story, less supply due to government intervention trying to keep prices high at all costs. If you watch the weekly inventory report you can see the market weakening even in the face of sub-5% rates, contingents and pendings falling, sales stagnant. All this with massive incentives and choked off supply.. it is clearly a vain attempt to keep the market propped up. I fully expect more housing incentives to hit the market they will just have to wait until after the November elections.

Short Sale & Foreclosures for the San Fernando Valley - June 2010


Here is the sales breakdown for the San Fernando Valley for June 2010. The SFV has a lot more late reporters as a percentage of sales and so it is a bit tougher to discern right now just how weak sales will ultimately be for May. It appears that sales should be even YoY when all the late reporters are counted. These sales levels are extremely weak historically and just an indication of this highly engineered market. With the end of the tax credit it appears it is going out with a whimper not a bang, it looks like the SFV will be down slightly YoY when the late reporters check in.

Monday, June 21, 2010

San Fernando Valley home sales report - May 2010

Note: I know that the weekly inventory reports are broken. Google broke their chart widgets and are working on restoring them.


San Fernando Valley Single Family Home sales for May 2010 came in at 679 which is up 5.43% MoM and down 4.10% YoY. This is the eighth straight month of YoY declines and the third worst May sales on record. The median price for single family homes came in at $385,000 which is down 1.58% MoM and up 10.00% YoY. The supply constrained market is hurting sales in the SFV. Supply is still down YoY but that looks to change by mid-year if the trend of low sales and rising inventory holds.


Condo sales came in at 213 which is down 1.84% MoM and down 5.75% YoY. Median price for condos came in at $233,000 which is down 6.80% MoM and up 25.94% YoY. Condos are faring better than SFH because there is more supply due to all the new condo construction during the boom and it appears some buyers are choosing to buy a condo when they can't find what they want in a detached home. Sales are still extremely low historically, just not as bad as SFH.

The line that is most interesting in this graph is the top green line. This denotes pending sales booked in May. Notice the large (20.9%) decrease during prime buying season. The red line is predicting a sales increase for June but May's predicted increase was muted. June will be tepid and July may be cliff diving. There is evidence of a very weak May home shopping season in the national news as well. It looks like things could start to get interesting again.