Showing posts with label conforming loan limits. Show all posts

Thursday, August 5, 2010

Ventura County Loan To Value Chart - January through June 2010

Note: The above chart can be clicked on and enlarged.

I haven't posted the loan to value charts in awhile. This one is for the period between January 2010 and June 2010.

The chart is simply purchase price on the left with loan to value ratio across the bottom. The different color coding indicates the type of loan (Conventional, FHA, Private Party or VA).

You can really see various underwriting guidelines come into play. That arching blue line going from top left sloping down right is the effect of the conforming loan limit on the conventional market. The solid line at 80% LTV is the effect of traditional underwriting guidelines with no Mortgage insurance. At 75% LTV that line usually indicates 2nd home purchases and the like. The blue line at 90% LTV most likely shows conventional loans with mortgage insurance. Then there is of course the absolutely massive wall of FHA financed properties.

I think the high LTV FHA high balance FHA loans are extremely risky. These are people who can't save and have high consumption. Their prospect for higher income is low but lower income is high and it isn't like they have shown a propensity for saving for a rainy day. Also FHA loans are underwritten to extremely high DTI ratios (as high as 47% front and 57% back end).

Sunday, November 8, 2009

Ventura County Loan To Value Chart - August 2009


Note: I haven't posted these charts in awhile so I am putting up May through August in four consecutive posts.

If you click and enlarge the chart it basically shows how much people are putting down at different price points. A dot at 80.0 and $300,000 means that a borrower put 20% down on a $300,000 place. This gives us a feel for how (down payments and loan types) people are getting into the market and where (sale price) they are getting into the market.

For people in the market right now if you go to the left hand side and look and find around the price at which you are thinking of buying and then you can go to the right and see what your competition has done as far as down payments and loan types.

The FHA loans at the higher price ranges are, in my opinion, very risky. FHA used to be for low income people and were underwritten with lower DTI ratios. Now they are used somewhat by high income people at higher income ratios, their prospect of higher income is low and lower income is high. I think this will affect the higher end move up markets as the people who rushed to buy have little to no equity for many years. I think this is true of FHA used in massive quantities in the market like we have now (which was 37.4% of the So Cal market in August according to Dataquick). With little down it will take that much longer to buildup significant equity and long term move up and relocation transactions in the market should stay low.

Ventura County Loan To Value Chart - July 2009


Note: I haven't posted these charts in awhile so I am putting up May through August in four consecutive posts.

If you click and enlarge the chart it basically shows how much people are putting down at different price points. A dot at 80.0 and $300,000 means that a borrower put 20% down on a $300,000 place. This gives us a feel for how (down payments and loan types) people are getting into the market and where (sale price) they are getting into the market.

For people in the market right now if you go to the left hand side and look and find around the price at which you are thinking of buying and then you can go to the right and see what your competition has done as far as down payments and loan types.

The FHA loans at the higher price ranges are, in my opinion, very risky. FHA used to be for low income people and were underwritten with lower DTI ratios. Now they are used somewhat by high income people at higher income ratios, their prospect of higher income is low and lower income is high. I think this will affect the higher end move up markets as the people who rushed to buy have little to no equity for many years. I think this is true of FHA used in massive quantities in the market like we have now (which was 37.2% of the So Cal market in July according to Dataquick). With little down it will take that much longer to buildup significant equity and long term move up and relocation transactions in the market should stay low.

Ventura County Loan To Value Chart - June 2009


Note: I haven't posted these charts in awhile so I am putting up May through August in four consecutive posts.

If you click and enlarge the chart it basically shows how much people are putting down at different price points. A dot at 80.0 and $300,000 means that a borrower put 20% down on a $300,000 place. This gives us a feel for how (down payments and loan types) people are getting into the market and where (sale price) they are getting into the market.

For people in the market right now if you go to the left hand side and look and find around the price at which you are thinking of buying and then you can go to the right and see what your competition has done as far as down payments and loan types.

The FHA loans at the higher price ranges are, in my opinion, very risky. FHA used to be for low income people and were underwritten with lower DTI ratios. Now they are used somewhat by high income people at higher income ratios, their prospect of higher income is low and lower income is high. I think this will affect the higher end move up markets as the people who rushed to buy have little to no equity for many years. I think this is true of FHA used in massive quantities in the market like we have now (which was 36.8% of the So Cal market in June according to Dataquick). With little down it will take that much longer to buildup significant equity and long term move up and relocation transactions in the market should stay low.

Ventura County Loan To Value Chart - May 2009

Note: I haven't posted these charts in awhile so I am putting up May through August in four consecutive posts.

If you click and enlarge the chart it basically shows how much people are putting down at different price points. A dot at 80.0 and $300,000 means that a borrower put 20% down on a $300,000 place. This gives us a feel for how (down payments and loan types) people are getting into the market and where (sale price) they are getting into the market.

For people in the market right now if you go to the left hand side and look and find around the price at which you are thinking of buying and then you can go to the right and see what your competition has done as far as down payments and loan types.

The FHA loans at the higher price ranges are, in my opinion, very risky. FHA used to be for low income people and were underwritten with lower DTI ratios. Now they are used somewhat by high income people at higher income ratios, their prospect of higher income is low and lower income is high. I think this will affect the higher end move up markets as the people who rushed to buy have little to no equity for many years. I think this is true of FHA used in massive quantities in the market like we have now (which was 38.4% of the So Cal market in May according to Dataquick). With little down it will take that much longer to buildup significant equity and long term move up and relocation transactions in the market should stay low.

Saturday, August 29, 2009

Ventura County Loan To Value Chart - April 2009


If you click and enlarge the chart it basically shows how much people are putting down at different price points. A dot at 80.0 and $300,000 means that a borrower put 20% down on a $300,000 place. This gives us a feel for how (down payments and loan types) people are getting into the market and where (sale price) they are getting into the market.

For people in the market right now if you go to the left hand side and look and find around the price at which you are thinking of buying and then you can go to the right and see what your competition has done as far as down payments and loan types.

The FHA loans at the higher price ranges are, in my opinion, very risky. FHA used to be for low income people and were underwritten with lower DTI ratios. Now they are used somewhat by high income people at higher income ratios, their prospect of higher income is low and lower income is high. I think this will affect the higher end move up markets as the people who rushed to buy have little to no equity for many years. I think this is true of FHA used in massive quantities in the market like we have now (which was 39.1% of the So Cal market in April according to Dataquick). With little down it will take that much longer to buildup significant equity and long term move up and relocation transactions in the market should stay low.

Friday, July 3, 2009

Ventura County Loan To Value comparison - March 2006 vs March 2009


This is a comparison of loan to value charts for Ventura County of March 2006 vs March 2009. If you click and enlarge the chart it basically shows how much people are putting down at different price points. A dot at 80.0 and $300,000 means that a borrower put 20% down on a $300,000 place. This gives us a feel for how people (down payments, monthly payments and loan type) are getting into the market and where (sale price) they are getting into the market. From my data pull I saw zero FHA loans in 2006.

For people in the market right now if you go to the left hand side and look and find around the price at which you are thinking of buying and then you can go to the right and see what your competition has done as far as down payments and loan types.

The FHA loans at the higher price ranges are, in my opinion, very risky. FHA used to be for low income people and were underwritten with lower DTI ratios. Now they are used somewhat by high income people at higher income ratios, their prospect of higher income is low and lower income is high. I think this will affect the higher end move up markets as the people who rushed to buy have little to no equity for many years. I think this is true of FHA used in massive quantities in the market like we have now (which was 39.1% of the So Cal market in April according to Dataquick). With little down it will take that much longer to buildup significant equity and long term move up and relocation transactions in the market should stay low.

Orange County Loan To Value comparison, July 2006 to April 2009


This is a comparison of loan to value charts for Orange County from July 2006 and April 2009. If you click and enlarge the chart it basically shows how much people are putting down at different price points. A dot at 80.0 and $300,000 means that a borrower put 20% down on a $300,000 place. This gives us a feel for how people (down payments, monthly payments and loan type) are getting into the market and where (sale price) they are getting into the market. From my data pull I saw zero FHA loans in 2006.
For people in the market right now if you go to the left hand side and look and find around the price at which you are thinking of buying and then you can go to the right and see what your competition has done as far as down payments and loan types.
The FHA loans at the higher price ranges are, in my opinion, very risky. FHA used to be for low income people and were underwritten with lower DTI ratios. Now they are used somewhat by high income people at higher income ratios, their prospect of higher income is low and lower income is high. I think this will affect the higher end move up markets as the people who rushed to buy have little to no equity for many years. I think this is true of FHA used in massive quantities in the market like we have now (which was 39.1% of the So Cal market in April according to Dataquick). With little down it will take that much longer to buildup significant equity and long term move up and relocation transactions in the market should stay low.

Sunday, June 28, 2009

Ventura County February 2009 Loan To Value chart

Here is the February 2009 Loan To Value chart for Ventura County. If you click and enlarge the chart it basically shows how much people are putting down at different price points. A dot at 80.0 and $300,000 means that a borrower put 20% down on a $300,000 place. This gives us a feel for how people (down payments, monthly payments and loan type) are getting into the market and where (sale price) they are getting into the market. For jumbo conforming it is getting very difficult to get PMI. So FHA is the only option for loans with less than 20% down.

For conforming loans it is getting difficult to get PMI above 90% LTV and this is where we see the rampant FHA activity. The Jumbo conforming loan limit was about to drop from 729k to 625k and many lenders were phasing it out by November. The jumbo conforming limit is back to 729k this year but its effect was marginal on the market to begin with.

For people in the market right now if you go to the left hand side and look and find around the price at which you are thinking of buying and then you can go to the right and see what your competition has done as far as down payments and loan types.

The FHA loans at the higher price ranges are, in my opinion, very risky. FHA used to be for low income people and were underwritten with lower DTI ratios. Now they are used somewhat by high income people at higher income ratios, their prospect of higher income is low and lower income is high. I think this will affect the higher end move up markets as the people who rushed to buy have little to no equity for many years. I think this is true of FHA used in massive quantities in the market like we have now (which was 38% of the So Cal market in February according to
Dataquick). With little down it will take that much longer to buildup significant equity and long term move up and relocation transactions in the market should stay low.

Note: I have added a foreclosure research link to the site, see here.

Wednesday, May 13, 2009

NAR calls for expanded tax credit

The NAR is calling for an increase in availability to the first time home buyer tax credit to anyone of any income level. They also are calling to make the raised conforming loan limits permanent. Many of the policies today (loan modification, foreclosure moratoriums) will actually reduce home sales in the future so I always thought it was curious that the NAR supported them. But if they just plan for the government to come in an subsidize sales for the foreseeable future I guess that is one way they can have their cake and eat it too. Can the handouts keep coming? When will people say enough is enough?

Sunday, May 3, 2009

Ventura County January 2009 Loan To Value chart


Here is the January 2009 Loan To Value chart for Ventura County. If you click and enlarge the chart it basically shows how much people are putting down at different price points. A dot at 80.0 and $300,000 means that a borrower put 20% down on a $300,000 place. This gives us a feel for how people (down payments, monthly payments and loan type) are getting into the market and where (sale price) they are getting into the market.
For jumbo conforming it is getting very difficult to get PMI. So FHA is the only option for loans with less than 20% down. For conforming loans it is getting difficult to get PMI above 90% LTV and this is where we see the rampant FHA activity. The Jumbo conforming loan limit was about to drop from 729k to 625k and many lenders were phasing it out by November. The jumbo conforming limit is back to 729k this year but its effect was marginal on the market to begin with.
For people in the market right now if you go to the left hand side and look and find around the price at which you are thinking of buying and then you can go to the right and see what your competition has done as far as down payments and loan types.
The FHA loans at the higher price ranges are, in my opinion, very risky. FHA used to be for low income people and were underwritten with lower DTI ratios. Now they are used somewhat by high income people at higher income ratios, their prospect of higher income is low and lower income is high. I think this will affect the higher end move up markets as the people who rushed to buy have little to no equity for many years. I think this is true of FHA used in massive quantities in the market like we have now (currently running 37.8% according to Dataquick). With little down it will take that much longer to buildup significant equity and long term move up and relocation transactions in the market should stay low.


Note: I have added a foreclosure research link to the site, see here.

Sunday, March 22, 2009

Ventura County December 2008 Loan To Value chart


Here is the December 2008 Loan To Value chart for Ventura County. If you click and enlarge the chart it basically shows how much people are putting down at different price points. A dot at 80.0 and $300,000 means that a borrower put 20% down on a $300,000 place. This gives us a feel for how people (down payments, monthly payments and loan type) are getting into the market and where (sale price) they are getting into the market.
The green shaded areas are places where private mortgage insurers are tightening and eliminating coverage. For jumbo conforming it is getting very difficult to get PMI. So FHA is the only option for loans with less than 20% down. For conforming loans it is getting difficult to get PMI above 90% LTV and this is where we see the rampant FHA activity. The Jumbo conforming loan limit was about to drop from 729k to 625k and many lenders were phasing it out by November. The jumbo conforming limit is back to 729k this year but its effect was marginal on the market to begin with.
For people in the market right now if you go to the left hand side and look and find around the price at which you are thinking of buying and then you can go to the right and see what your competition has done as far as down payments and loan types.
The FHA loans at the higher price ranges are, in my opinion, very risky. FHA used to be for low income people and were underwritten with lower DTI ratios. Now they are used somewhat by high income people at higher income ratios, their prospect of higher income is low and lower income is high. I think this will affect the higher end move up markets as the people who rushed to buy have little to no equity for many years. I think this is true of FHA used in massive quantities in the market like we have now (currently running 38% according to Dataquick). With little down it will take that much longer to buildup significant equity and long term move up and relocation transactions in the market should stay low.

Friday, March 13, 2009

Conforming Jumbo and Mortgage Insurance in California

One of the changes in the stimulus bill was to raise the "Conforming Jumbo", loans greater than the conforming limit but still eligible for purchase by the GSE's, loan limits back to $729,750. From the previous LTV charts I've posted I've tried to define what is going on in the space between conforming and the jumbo conforming loan limits. I think the effect of the limits being raised back to $729,750 will be even more muted than it was last year. The reason why is that private mortgage insurance is increasingly becoming harder and harder to find in California for the conforming jumbo space.

Here is a summary of the private mortgage insurers I looked at..

  • MGIC - Has a maximum loan amount of $650,000 for California. Will only underwrite mortgage insurance for LTV's <= 85% for those jumbo conforming loans.
  • Radian - No Conforming Jumbos allowed at all. No Condos, Attached PUDs or second homes allowed for any product. 720 fico minimum required. They basically will only do 10% down conforming full doc files now.
  • PMI - No Conforming Jumbos allowed in distressed markets. California is on their distressed market list.
  • Genworth - No Conforming Jumbos allowed in distressed markets. California is on their distressed market list.

The only low down option for borrowers seems to be FHA. But FHA underwriting is stricter and FHA insurance is expensive. The front end ratio will stop most deals. There are other factors like how they calculate income which would disallow even more borrowers. Then of course is the minimum property requirements that must be met in order for the property to qualify for a FHA loan. Needless to say I don't think jumbo conforming loans will have much of an effect on this upcoming buying season.

Saturday, March 7, 2009

Some mortgage underwriting changes for the upcoming home buying season.

For the upcoming home buying season there are several changes to mortgage underwriting guidelines that will affect the selling season.

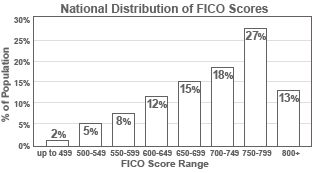
I think the most major change upcoming is that most major lenders are going to a 620 minimum FICO score. FHA doesn't have a minimum score in the underwriting guidelines but lenders can be restricted from selling their FHA loans if their default rates are too high (more about the recent trends of FHA defaults here). Since FHA is "it" for subprime loans right now nobody wants to lose access to that market so the lenders are putting their overlays on the lending guidelines to improve performance of their book. Not all lenders are at 620 right now but major players like Wells Fargo, Taylor Bean & Whitaker and Countrywide have announced the change. It is expected that most other lenders will be adopting this guideline as well.

Here is the national FICO distribution so you can get a feel for the number of people affected:

The loan limits for "Conventional Jumbo" are going back up to $729,750 for Los Angeles and Ventura Counties. But as we saw from the earlier LTV charts, their effect on the market was marginal and promises to be even less effective this next year because some major mortgage insurance companies have stopped underwriting conforming jumbo loans and many others only giving insurance for conforming jumbo at 85% LTV.

Monday, February 23, 2009

Ventura County November 2008 Loan To Value chart


Here is the November 2008 Loan To Value chart for Ventura County. If you click and enlarge the chart it basically shows how much people are putting down at different price points. A dot at 80.0 and $300,000 means that a borrower put 20% down on a $300,000 place. This gives us a feel for how people (down payments, monthly payments and loan type) are getting into the market and where (sale price) they are getting into the market.
The yellow shaded areas are places where private mortgage insurers are tightening and eliminating coverage. For jumbo conforming it is getting very difficult to get PMI. So FHA is the only option for loans with less than 20% down. For conforming loans it is getting difficult to get PMI above 90% LTV and this is where we see the rampant FHA activity. The Jumbo conforming loan limit was about to drop from 729k to 625k and many lenders were phasing it out by November. The jumbo conforming limit is back to 729k but its effect was marginal on the market to begin with.

Friday, January 2, 2009

Ventura County October 2008 Loan to Value chart

(click to enlarge)

This is the October 2008 Loan to Value chart for Ventura County. Here is a summary of what the chart is telling us from last months post on the topic:

The left axis represents the purchase price of a home and the bottom axis represents the LTV of the loans on the homes at purchase. So a dot at $300,000 and 80 LTV would mean that a borrower put $60,000 dollars down on a $300,000 home and the loans on the home total $240,000. The higher the LTV the more aggressive the loan is considered to be. By click on the graphic you will notice the almost solid red line at around 97% LTV. This represents FHA singular dominance in the aggressive lending arena. The shaded blue area represents where private mortgage insurance is bring eliminated for conforming loans (Loans under $417,000). The shaded green area represents where private mortgage insurance is being eliminated for "Jumbo conforming" loans (those under the jumbo conforming limit which was $729k and is being lowered to $598k January 1st, 2009). In these two shaded areas the blue dots (conventional) should disappear by early 2009 and only red dots (FHA) should remain. The pink line represents the old jumbo conforming limit and the green line represents the new jumbo conforming limit. The loans in between these two lines will most likely not be made after January 1st. Or if they are made they will be made at much higher rates than those under the limits shown.


I should also note that October 1st 2008 was the deadline for locking Seller Funded Down Payment Assistance loans for FHA. This was the last major easily available source of 100% financing. While I think FHA will continue its significant presence for a long time the requirement of even a mere 3.5% down coming from the borrower will have a dampening effect on the market. Lower prices and lowered expectations (buying less house) by borrowers with little down payment will be the result of this change. With the jumbo conforming limit dropping, slow economy and lack of move up buyers being generated in this market means that it is the higher end turn to experience the brunt of the depreciation in 2009. The low end will still fall of course but we could see the bottom end dropping 15% while the top end drops 25% as an example of what I think could go on this year. The desire to purchase high end properties is always there, what isn't there right now is the ability to do so.

Friday, December 26, 2008

FHA gaining in latest September 2008 Ventura County LTV chart

(click to enlarge)
This is the Loan to Value chart for Ventura County September 2008. The left axis represents the purchase price of a home and the bottom axis represents the LTV of the loans on the homes at purchase. So a dot at $300,000 and 80 LTV would mean that a borrower put $60,000 dollars down on a $300,000 home and the loans on the home total $240,000. The higher the LTV the more aggressive the loan is considered to be. By click on the graphic you will notice the almost solid red line at around 97% LTV. This represents FHA singular dominance in the aggressive lending arena. The shaded blue area represents where private mortgage insurance is bring eliminated for conforming loans (Loans under $417,000). The shaded green area represents where private mortgage insurance is being eliminated for "Jumbo conforming" loans (those under the jumbo conforming limit which was $729k and is being lowered to $598k January 1st, 2009). In these two shaded areas the blue dots (conventional) should disappear by early 2009 and only red dots (FHA) should remain. The pink line represents the old jumbo conforming limit and the green line represents the new jumbo conforming limit. The loans in between these two lines will most likely not be made after January 1st. Or if they are made they will be made at much higher rates than those under the limits shown.

The WSJ had an article on the FHA tonight that ties with what the chart is telling us is happening in the marketplace (emphasis added) :
The FHA, which insures lenders against defaults on home mortgages that meet the agency's standards, saw its share of new mortgages increase to 26% in this year's third quarter, up from 3% for all of 2007, according to Inside Mortgage Finance.
Some worry that the growth has come too fast, especially as the FHA expands rapidly into the most risky markets and insures bigger loans.
...
Still, some housing experts worry that an outsized share of the FHA's new business is coming in these high-cost housing markets. "It's getting into markets that are a lot riskier than it has in the past," says Ann Schnare, a housing consultant.
...
Private mortgage insurers are more restrictive. For instance, Genworth Mortgage Insurance Corp. requires down payments of at least 10% in areas with falling home prices and 15% if the loan is larger than $417,000.
...
As the private market imposes much tougher standards, the danger is that the riskiest loans will flow to the FHA, says Joe Rogers, an executive vice president in the home mortgage business of Wells Fargo & Co.
Financing and the home loan market are a slow moving train, the fate of whether or not some of these decisions made to be aggressive in the face of a falling market won't be decided for some time now. But if the FHA is wrong it is the taxpayer that will be bailing them out. Business Week had an article on FHA and how some of the brokers were gaming the system just like during the subprime boom. If enforcement isn't stepped up to police the originators this issue could blow up even bigger than expected. Putting a large number of people who clearly have an unreasonable expectation for price appreciation for homes into instantly underwater homes during a downward economy sure doesn't seem like a good idea. Defaults on these originations should reach very high levels and I can imagine a congressional hearing sometime in the future when the taxpayers will be asked to pay for this when some FHA official will be saying, "Nobody could have possibly seen this coming".

Sunday, December 14, 2008

Mortgage Insurers tighten underwriting again.

This James Lockhart quote made me want to review any new mortgage insurance guidelines:

“You will probably see in the next quarter the Fannie and Freddie lines going down and FHA coming up,” Lockhart said. “Fannie and Freddie are so dependent on mortgage insurers because they can only buy loans with 80 percent loan-to-value ratios and they aren’t able to do as much.”
“In some markets, the mortgage insurers have tighter standards than Fannie and Freddie,” Lockhart said. “So if someone wants more than an 80 percent loan-to-value, they have to go to FHA.”


A bit of an exaggeration but it is very true the mortgage insurers have tightened considerably in California.

The current guidelines can be summed up by the following criteria, for conforming limits 90% LTV and 720 FICO. For Conforming Jumbo 85% LTV and 720 FICO. There are minor variations on max Debt to Income (DTI) but most max out at 45%. One insurer (United Guaranty) won't insure a loan over the conforming amount in severely declining market. Which brings us to another common theme of the insurers, if they break out a state in declining severity California is considered in the worst classification.

The "Jumbo" conforming limit is dropping from $729k to $625k for Los Angeles County and down to $598k for Ventura County. In addition mortgage insurance on the mortgages between $417k and the jumbo conforming limit face either coming up with 15% down or going FHA with its expenses and restrictions (not all properties or borrowers qualify).

If you would like to take a look at the mortgage insurers guidelines they can be found here, here, here, here and here.

Saturday, November 8, 2008

August 2008 Ventura County Loan to Value Chart


Here is the Loan to Value scatter chart for Ventura County for homes and condos sold in August 2008. The upper pink line represents the current conforming jumbo limit and the lower pink line represents the new conforming jumbo limit starting January 1st. The loans in between these two lines won't be closed without either a higher down payment or seller price concessions. The yellow shaded area represents the area in which mortgage insurance is tightening that I detailed in my previous post. FHA or banks taking seconds will be the only option available to borrowers in this area. You can see that FHA is definitely gaining in popularity with fewer blue dots (representing conventional loans) populating this area compared to previous months. Credit is still tightening and only price concessions are keeping sales volumes up. If those price concessions slow due to things like foreclosure moratoriums or loan modifications sales volumes should drop considerably in response.

Friday, November 7, 2008

FHFA announce conforming limits, Ventura County adversely affected.

On January 1st, 2009 the new max conforming limit for the country will be $625,500 down from the current jumbo conforming max of $729,750. I think this change will hurt the mid to mid-high end of the market a lot. Ventura County it is a bit worse in that the FHFA decided that the max conforming limit will be $598,000. These conforming limit changes combined with the guideline changes from October and the new ones coming online in January (Freddie Mac will only allow a max-DTI of 45% on the vast majority of its loans) will significantly affect effective demand moving forward. This isn't even addressing the economic issues facing these areas which will affect demand. Just assuming the pool of available buyers remained normal demand would fall. Only price declines can solve the issue of finding an available buyer when loan demand is contracting.