Showing posts with label July. Show all posts

Saturday, August 21, 2010

San Fernando Valley home sales report - July 2010


San Fernando Valley Single Family Home sales for July 2010 came in at 589 which is down 9.24% MoM and down 20.94% YoY. This is the tenth straight month of YoY declines and the WORST July on record for Single Family Home sales. The median price for single family homes came in at $399,000 which is up 3.64% MoM and down 0.25% YoY. Residential inventory is officially up YoY but inventory is still light. The market is completed stagnated, the administration is keeping the motivated inventory generally off the market and there is no market clearing event so sales and buyers choices will continue to be horrible going forward. New pendings last month were at levels suggesting August will come in at or slightly below July which would make for the worst August on record.


Condo sales came in at 216 which is down 17.56% MoM and up 6.40% YoY. Median price for condos came in at $220,000 which is down 4.34% MoM and down 3.50% YoY. The only strength in the market is in the condo space and I think that is due more to the amount of motivated supply (whole condo projects going defunct). Condo pendings aren't strong going forward and are at levels suggesting that August sales will look very much like July.
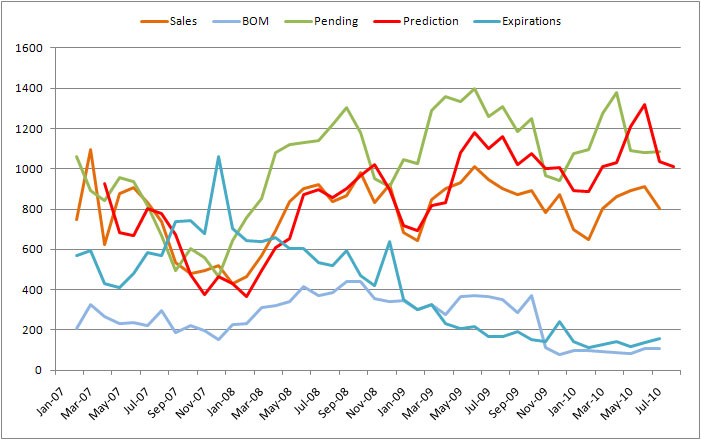

Based on July pendings (green line) the predictor (red line) suggest slightly lower sales for August.

I predict the NAR will be going hat in hand to Congress for another tax credit soon (probably after the elections). With sales this bad they will try to get another handout.

Tuesday, August 17, 2010

Ventura County July 2010 Home Sales


Dataquick reported home sales for Ventura County for July 2010 today. Home sales came in at 749 down 10.5% YoY and down 15.8% MoM. The median sales price came in at $370,000 down 5.20% YoY and 3.6% MoM. Volume was in range from what I predicted at the beginning of the month. This amounts to the worst July since back for when I have records as far as sales volume. Right now August is looking weaker but with closings weighted towards the end of the month anything can happen. I highly doubt we'd see even July level volume in August though. If you follow the weekly inventory reports for Ventura County you can see the contingents have fallen but then leveled out as sellers respond with price cuts. It looks like a long slow slog from here on out.

Monday, August 2, 2010

Short Sale & Foreclosure for Ventura County - July 2010


Here are the sales for Ventura County for July 2010. Sales are still very low, with late reporters I expect the official Dataquick numbers will be down 10-15% at around 730 sales. This continued stagnation in the market is the same boring story, less supply due to government intervention trying to keep prices high at all costs. Watching the weekly inventory reports for Ventura County you can see supply building but contingents and pendings have stopped falling rapidly due to continued price cuts by sellers. The current level of demand is still extremely low reminiscent of January/February demand levels but when the sellers get the price right the homes fly off the market.

Short Sale & Foreclosures for the San Fernando Valley - July 2010


Here is the sales breakdown for the San Fernando Valley for July 2010. The SFV has a lot more late reporters as a percentage of sales and so it is a bit tougher to discern right now just how weak sales will ultimately be for July. It appears that sales should be down 10-15% YoY when all the late reporters are counted. These sales levels are extremely weak historically.

Sunday, November 8, 2009

Ventura County Loan To Value Chart - July 2009


Note: I haven't posted these charts in awhile so I am putting up May through August in four consecutive posts.

If you click and enlarge the chart it basically shows how much people are putting down at different price points. A dot at 80.0 and $300,000 means that a borrower put 20% down on a $300,000 place. This gives us a feel for how (down payments and loan types) people are getting into the market and where (sale price) they are getting into the market.

For people in the market right now if you go to the left hand side and look and find around the price at which you are thinking of buying and then you can go to the right and see what your competition has done as far as down payments and loan types.

The FHA loans at the higher price ranges are, in my opinion, very risky. FHA used to be for low income people and were underwritten with lower DTI ratios. Now they are used somewhat by high income people at higher income ratios, their prospect of higher income is low and lower income is high. I think this will affect the higher end move up markets as the people who rushed to buy have little to no equity for many years. I think this is true of FHA used in massive quantities in the market like we have now (which was 37.2% of the So Cal market in July according to Dataquick). With little down it will take that much longer to buildup significant equity and long term move up and relocation transactions in the market should stay low.

Wednesday, August 26, 2009

Sunday, August 23, 2009

San Fernando Valley Inventory July 2009


Source: SRAR
From the following graphics you can see the drop in inventory, especially on the low end. As well as the fact that in many spots demand is lower for the market segment but Months Supply has still dropped.
The SFV is a supply constrained market. But help may be on the way.... (foreshadowing to a August 31st report..)

Saturday, August 22, 2009

San Fernando Valley home sales report - July 2009


San Fernando Valley Single Family Home sales for July 2009 came in at 745 which is down 3.87% MoM and up 3.91% YoY. The median price for single family homes came in at $400,000 which is up 6.67% MoM and down 8.05% YoY. The movement of mid-level homes down the price change has opened that market a bit which is causing the mix shift to rise. Sales volume is still horrible with this being the 4th worst July on record. Considering interest rates are down over 1% since last year and the tax credit is in effect that is quite amazing that sales volume is still so bad. Part of the reason sales are so bad are due to inventory issues of the market. Inventory is quite low, especially in the affordable ranges. This is due to the foreclosures being leaked on the market and long processing times for short sales. There is a massive amount of inventory sitting at pending and contingent in the SFV and much of that can still be considered active inventory. Between that inventory and foreclosures slowly starting to increase inventory issues should lighten up going into September.


Condo sales came in at 203 which is down 13.98% MoM and down .97% YoY. Median price for condos came in at $228,000 which is up .88% MoM and down 18.57% YoY. Condos continue to perform horribly with this being the 5th worst July on record. There are a lot of condo projects in the Valley which only put 1 or 2 units on the MLS so inventory is definitely underrepresented.


There are a lot of lines on this chart. The red line is the prediction for next months sales. The predictor line hasn't been fairing well, over predicting the last few months. I think this is a combination of fewer homes able to close and longer underwriting times. I expect sales to be down slightly next month. There are still more homes going on market than sold, yet expiration's are dropping and inventory is going down. Strange.

Monday, August 3, 2009

Short Sale & Foreclosure for Ventura County


Note: I have added a foreclosure research link to the site, see here

Here is the sales breakdown for Ventura County for July 2009. I expect some late reporters to increase the total sales just a bit but I don't think July 2009 will beat July 2008 in terms of sales. Sales level seem to have hit their peak so far. I don't think that will change unless servicers get extra motivated on short sales or new foreclosure inventory comes on market. By looking at the weekly inventory reports posted every Saturday here we can see that the inventory decline seems to be over. It also appears like pendings and contingents have peaked for Ventura County. Short Sales did show their highest levels since I've been measuring them. While foreclosures have been declining as a percentage of sales I would expect that percentage to increase around Octobers numbers through next February as higher supply meets lowered seasonal demand.

Saturday, August 1, 2009

Ventura County Trustee sales for July 2009


Here are the trustee sales for Ventura county, July 2009. Trustee sales dropped 21.80% MoM and 52.29% YoY. July 2008 has been the peak of this cycle so far. Third party sales continue to increase as trustee sales investors are grabbing every deal they can with the belief they can move inventory through this low foreclosure inventory environment. I know there is a very active investment group in the Simi Valley area, in one week they grabbed 70% of the available homes.

Trustee Sales for Los Angeles County July 2009


Here are the trustee sales for Los Angeles county, July 2009. Trustee sales dropped 15.18% MoM and 34.42% YoY. July 2008 has been the peak of this cycle so far. Third party sales continue to increase but not as much as other counties profiled. This suggests either there are some missed opportunities at the courthouse steps or prices are falling here more than other areas.

San Diego Trustee Sales July 2009


Here are the trustee sales for San Diego county, July 2009. Trustee sales dropped 23.03% MoM and 42.90% YoY. July 2008 has been the peak of this cycle so far. Third party sales continue to increase as trustee sales investors are grabbing every deal they can with the belief they can move inventory through this low foreclosure inventory environment.

Orange County Trustee sales for July 2009


Here are the trustee sales for Orange County, July 2009. Trustee sales dropped 11.96% MoM and 47.13% YoY. July 2008 has been the peak of this cycle so far. Third party sales are still brisk and clearly trustee sales investors are grabbing every deal they can with the belief they can move inventory through this low inventory environment.

Tuesday, July 28, 2009

Ventura County Demand versus Inventory - July 2009

This is June 2009 Demand versus Inventory for Ventura County. I have broke down demand into 3 separate parts, Completed sales, properties under some sort of contingent contract and properties that have cleared contingencies and are waiting to close escrow. If you compare this months chart with last months chart we see demand pending/contingent demand starting to weaken further on the high end where it appears the seasonal rush is over. Inventory in the middle ranges looks like it is improving and the drops in inventory on the higher end appears to be sellers dropping price as the lower price points increase at the same time the higher ends decrease. It is clear all the major activity is on the low end but supply is still constrained. Buyers aren't able to push price and are just searching for deals wherever they can find them.

Thursday, July 16, 2009

Mid-July Foreclosure update for San Diego County


Here is the mid-month update for San Diego County for July 2009. The pace of sales have slowed month over month but the third party participation is rising. Investors are feeling more confident in their ability to buy at the courthouse (wholesale) and selling on the MLS (retail).

Mid-July Foreclosure update for Orange County


Here is the Mid-month update for Orange County for July 2009. Third party sales are still at what I would consider "speculative" levels. The pace of sales have slowed somewhat from the previous month probably from the foreclosure moratorium. Even though most servicers are exempt they appear to be holding off on foreclosing anyways.

Mid-July Foreclosure update for Los Angeles County


Here is the mid-month update of trustee sales for July 2009 for Los Angeles County. Sales are at a slower pace than June and 3rd party participation is the lowest of the 4 counties being tracked suggesting some opportunity for investors to jump in.

Mid-July Foreclosure update for Ventura County


Here is a mid-July update of trustee sales for Ventura County. Sales have slowed a bit, possibly due to the foreclosure moratorium even though most servicers are exempt. I think the level of third party sales is reaching speculative levels. They are particularly concentrated in Simi Valley and Oxnard. The Simi Valley group has purchased 7 of the last 10 trustee sales and is clearly trying to corner the market and push price.

Saturday, November 8, 2008

August 2008 Ventura County Loan to Value Chart


Here is the Loan to Value scatter chart for Ventura County for homes and condos sold in August 2008. The upper pink line represents the current conforming jumbo limit and the lower pink line represents the new conforming jumbo limit starting January 1st. The loans in between these two lines won't be closed without either a higher down payment or seller price concessions. The yellow shaded area represents the area in which mortgage insurance is tightening that I detailed in my previous post. FHA or banks taking seconds will be the only option available to borrowers in this area. You can see that FHA is definitely gaining in popularity with fewer blue dots (representing conventional loans) populating this area compared to previous months. Credit is still tightening and only price concessions are keeping sales volumes up. If those price concessions slow due to things like foreclosure moratoriums or loan modifications sales volumes should drop considerably in response.

Sunday, October 5, 2008

Ventura County June & July 2008 down payment size


Here is the scatter charts for Ventura County for June and July. Clearly FHA is gaining in popularity and taking over market share. The loans "at risk" for tightening are the blue dots between 80% and 100% LTV these are the ones affected by mortgage insurers guideline changes. The one issue affecting FHA is seller funded down payment assistance went away October 1st and was very popular. The mortgage insurers are still tightening especially in the main bubble markets like Florida and California.