Showing posts with label October. Show all posts

Tuesday, November 30, 2010

San Fernando Valley home sales report - October 2010


San Fernando Valley Single Family Home sales for October 2010 came in at 532 which is down 8.43% MoM and down 19.76% YoY. This is the thirteenth straight month of YoY declines and the second worst October on record for Single Family Home sales. The median price for single family homes came in at $385,000 which is down 2.53% MoM and up 1.28% YoY. The market is completed stagnated, the administration is keeping the motivated inventory generally off the market and there is no market clearing event so sales and buyers choices will continue to be horrible going forward. New pendings last month were at levels suggesting November will come in at October levels.


Condo sales came in at 168 which is down 13.40% MoM and down 26.31% YoY. Median price for condos came in at $220,000 which is even MoM and down 6.38% YoY. Relative to SFH condos have been performing better but that is because there is more motivated condo supply than SFH. Sales are still horrible in historical context, just not as bad as SFH.

Based on October pendings (green line) the predictor (red line) suggest sales for November coming in about even.

Wednesday, November 17, 2010

Ventura County October 2010 Home Sales


Dataquick reported home sales for Ventura County for October 2010 today. Home sales came in at 619 down 29.6% YoY and down 9.2% MoM. The median sales price came in at $355,000 down 2.7% YoY and down 4.0% MoM. This was in line with the prediction I made at the beginning of the month for closed sales. Currently Novembers pace is running basically flat to slightly raised. These sales numbers are horrible and are only beaten historically by the sales numbers that were posted after the subprime and Alt-A market imploded and most of the lenders weren't geared up for FHA or Conventional back in the fall of 2007. Prices will continue falling with a sales pace as anemic as this. It is a post tax break sugar rush let down but the question becomes where the demand will come from? The best case scenario is everyone looking towards spring and hoping there is some level of pent up demand waiting for the first of the year to buy.


Wednesday, November 3, 2010

Short Sale & Foreclosure for Ventura County - October 2010


Here are the sales for Ventura County October 2010. Based on me taking statistics a bit later than usual and adjusting for recent changes in the underlying data sources I think the Dataquick number will be around 600 for October. This is very low sales levels usually only seen around the winter months. Sellers keep cutting prices looking for buyers but its just a slow time of year (see Mortgage Purchase Applications Index for proof) so things don't look to be getting better anytime soon. Interest rates are set up to reach sub 4% levels and supply is muted and adjusting price slowly to the new reality. Stagnation appears to be the case still for the next few months (and probably beyond).

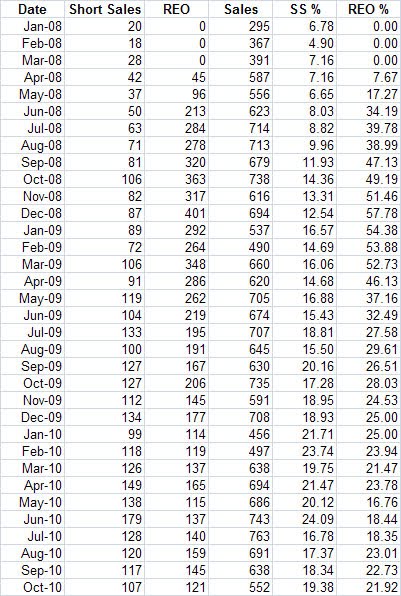
Short Sale & Foreclosures for the San Fernando Valley - October 2010


Here is the sales breakdown for the San Fernando Valley for October 2010. The SFV has a lot more late reporters as a percentage of sales and so it is a bit tougher to discern right now just how weak sales will ultimately be for October. But, it appears that sales should be at the same levels as August perhaps slightly weaker.

Saturday, November 21, 2009

San Fernando Valley home sales report - October 2009


San Fernando Valley Single Family Home sales for October 2009 came in at 663 which is down 3.07% MoM and down 11.01% YoY. The median price for single family homes came in at $390,000 which is up 2.63% MoM and down 4.88% YoY. Sales continue to be tremendously depressed even in the face of massive housing focused stimulus. The flip side of asset price stability is sub par transactional volume, there is no free lunch. Single Family Home sales are at levels not seen since the early 90's which was a deep recession locally in the San Fernando Valley.


Condo sales came in at 228 which is up 20.63% MoM and down 2.56% YoY. Median price for condos came in at $235,000 which is up 1.29% MoM and up 4.44% YoY. Condos are faring a bit better than SFH because there is more supply and it appears some buyers are choosing to buy a condo when they can't find what they want in a detached home.

The red line was my attempt to create a predictor for sales but it hasn't been working out so well since May of this last year. IMHO, it appears that some pendings are being double counted, instead of falling out and going BOM (which would reduce my predictor), they are just switching buyers and updating the pending date which gets them counted in the current months pendings again. This is supposition on my part since I don't know how SRAR constructs their numbers but nothing much else makes sense.

I think because of the large number of pendings, many of them short sales, and longer underwriting times by lender we will see a more flattened out sales curve going into the slow winter months. While sales will still be very low I would guess January and February will beat YoY numbers but I think November and December will be flat to lower than the year before.

Tuesday, November 17, 2009

Ventura County October 2009 Home Sales


Dataquick reported home sales for Ventura County for October 2009 today. Home sales came in at 879, up 9.6% YoY. The median sales prices came in at $365,000 which was down 2.7% YoY. Assuming people lock the month before they close September 2008 rates were 6.04%, September 2009 rates were 5.06%. Such a dramatic drop in rates combined with the tax credit expiration (it has been extended but people who would have wanted to take advantage of it would have had to sign contracts before it was extended) and the desire to close before the holidays start all made October the best sales month of the year. We will now see sales drop due to seasonality and the lack of inventory on the market. Rates are below 5% currently but there is little motivating reason for purchasing right now. Between the holidays and the lack of selection people purchasing now have either lucked out and found 'the one' or just settled on a lesser home.
I expect November to come in flat to slightly down YoY and December to definitely be lower YoY for sales. We are at historically very low sales and very little evidence of that changing anytime soon. Prices kept artificially high will mean sales will be kept artificially low.

Monday, November 2, 2009

Short Sale & Foreclosures for the San Fernando Valley - October 2009


Note: I have added a foreclosure research link to the site, see here
Here is the sales breakdown for the San Fernando Valley for October 2009. Note, September 2009 had a much higher percentage of late reporters than usual but even if October matches the late reporters in percentage terms sales will still have dropped YoY. Fewer total distressed sales will mean fewer sales until prices align with incomes. The tax credit is becoming much less of a boost for sales and I would expect October and next April/May (if extended as expected) to be the last month of significant boost in sales by the credit.

Short Sale & Foreclosure for Ventura County - October 2009


Note: I have added a foreclosure research link to the site, see here

Here is the breakdown of sales for Ventura County for October 2009. With late reporters I would expect sales to be around 730-740 for the month or roughly flat to down with last year. It will be interesting to see how many sales were rushed in order to make sure they get the tax credit. Last year the $7,500 tax credit was passed on July 30th and I think that helped sales volume in October along with the desire to close escrow before the holidays. This year the fear of the tax credit expiration and the same seasonal factors I believe helped sales volume but sales are still weak historically only off the ultra-never-seen-before lows of late 2007.

Saturday, October 31, 2009

San Diego Trustee Sales October 2009


San Diego trustee sales for October 2009 came in at 1336. This was the best showing since June.

Orange County Trustee sales for October 2009


Orange County trustee sales for October 2009 came in at 857. This was the best showing since June 2009. As always I am impressed with how many trustee sales in Orange County go to a third party. I have a hard time believing there are enough deals that pencil out to support near 40% third party sales to investors. I wonder if owner occupied buyers are just dealing with low inventory by paying retail (or close to it) on the courthouse steps.

Trustee Sales for Los Angeles County October 2009


Los Angeles County Trustee sales came in at 3437 for October 2009. This is the highest total since June. It will be interesting to see if this trustee sale momentum continues.

Ventura County Trustee sales for October 2009


Trustee sales for October 2009 in Ventura County came in at 303. This was a bit higher than I expected and the best showing since June. Third party trustee sales continue to gain momentum as investors rush in to take advantage of the low supply enviroment.

Wednesday, October 28, 2009

Ventura County Demand versus Inventory - October 2009


I have been a bit busier the last month or so and this chart was one of the casualties last month. This is the demand vs inventory chart for Ventura County current as of today. I split the chart up into Single Family Homes (SFH) and condos. Note the X-axis on the charts are different as is (unfortunately) the color coding so make sure to check the legend on the chart to orient yourself when you click to enlarge. As you can see inventory is very low on the low end. The huge number of contingents represent a lot of short sales just sitting their not being processed. The mid to upper end of the market clearly needs some adjustment and the low end is doing pretty well because supply is being choked off by various programs.
If there is a big need I can make the combined chart so people can compare todays demand to earlier months but this gives you the general sense of the market as we stand today. If I was a RE professional I would be thinking about what those charts represent.... Slower sales in the coming months due to low supply in the high demand segments.

Friday, October 16, 2009

San Diego Trustee Sales Mid-October 2009


Here is the mid-October 2009 trustee sale update for San Diego County. Currently San Diego is on a sales pace for 1470 sales for the month. But due to fewer trustee sales being scheduled in the second half of the month I expect sales to come in around 1300 or so.

Orange County Trustee sales for Mid-October 2009


Here is the mid-October 2009 Orange County trustee sale update. Currently sales are on a pace to 878 sales for the month. Due to the fact that fewer trustee sales are scheduled the second half of the month than the first I expect sales to come in around 810 or so.

Trustee Sales for Los Angeles County Mid-October 2009


Here is the mid-October 2009 trustee sale update for Los Angeles County. Currently sales are on a pace to hit 3600 sales by the end of the month. Since there are fewer trustee sales scheduled over the next 10 business days than the previous 11 I expect sales to fall short.. around 3000-3100 for the month.

Ventura County Trustee sales for Mid-October 2009


Here is the mid-October 2009 trustee sale update for Ventura County. Currently sales are running on a pace of about 315-320 sales for the whole month which would be the highest monthly sales since June. I don't think the sale pace of the second half of the month will match the first due to the fact that the number of trustee sales scheduled for the rest of October is lighter than it was for the first half. I think sales will probably come in around 280, or marginally higher than the previous few months pace. While there hasn't been any rumblings of a holiday moratorium I am expecting at least the GSEs to institute one, but that is supposition on my part. If we do see a moratorium it should last from the last week of November through the beginning of January. This wouldn't mean no sales, just a reduced pace.

Friday, January 2, 2009

Ventura County October 2008 Loan to Value chart

(click to enlarge)

This is the October 2008 Loan to Value chart for Ventura County. Here is a summary of what the chart is telling us from last months post on the topic:

The left axis represents the purchase price of a home and the bottom axis represents the LTV of the loans on the homes at purchase. So a dot at $300,000 and 80 LTV would mean that a borrower put $60,000 dollars down on a $300,000 home and the loans on the home total $240,000. The higher the LTV the more aggressive the loan is considered to be. By click on the graphic you will notice the almost solid red line at around 97% LTV. This represents FHA singular dominance in the aggressive lending arena. The shaded blue area represents where private mortgage insurance is bring eliminated for conforming loans (Loans under $417,000). The shaded green area represents where private mortgage insurance is being eliminated for "Jumbo conforming" loans (those under the jumbo conforming limit which was $729k and is being lowered to $598k January 1st, 2009). In these two shaded areas the blue dots (conventional) should disappear by early 2009 and only red dots (FHA) should remain. The pink line represents the old jumbo conforming limit and the green line represents the new jumbo conforming limit. The loans in between these two lines will most likely not be made after January 1st. Or if they are made they will be made at much higher rates than those under the limits shown.


I should also note that October 1st 2008 was the deadline for locking Seller Funded Down Payment Assistance loans for FHA. This was the last major easily available source of 100% financing. While I think FHA will continue its significant presence for a long time the requirement of even a mere 3.5% down coming from the borrower will have a dampening effect on the market. Lower prices and lowered expectations (buying less house) by borrowers with little down payment will be the result of this change. With the jumbo conforming limit dropping, slow economy and lack of move up buyers being generated in this market means that it is the higher end turn to experience the brunt of the depreciation in 2009. The low end will still fall of course but we could see the bottom end dropping 15% while the top end drops 25% as an example of what I think could go on this year. The desire to purchase high end properties is always there, what isn't there right now is the ability to do so.

Tuesday, November 25, 2008

Back on Market for San Fernando Valley October 2008

Graph of Total Sales, Total Back On Market (BOM) and monthly Pendings:
Back on market as percentage of current pendings and previous months pendings:

Back on market as a percentage of the average of the previous 3 months pendings average:
Total Back on market came in at 439, down 1 from 440 the month before and up 219 from 220 the year before.

Pendings for October 2008 came in at 1180, down 120 from 1305 the month before and up 574 from 606 the year before. Fallout is still very high and if pendings slow down even a little we will see a dramatic drop off in sales.

Thursday, November 20, 2008

San Fernando Valley October 2008 home sales report


The official October 2008 numbers are out. Home sales (SFH) came in at 745, a 13.22% increase MoM and 110.45% increase YoY. Last year at this time we were in the depth of the secondary mortgage market shutting down causing a historic low in sales. Now that prices are adjusting downward sales are picking up a bit though still historically weak. Median price came in at $410,000, up 4.46% MoM and down 30.51% from last year. Median prices are down over $245,000 from the peak.


Condo sales came in at 234, a 10.90% increase MoM and 82.81% increase YoY. Median price came in at $225,000, down 13.46% MoM and down 40.79% from last year. Condo median prices are down over $190,000 from the peak.
There was a significant number of late reporters last month so I will update my short sale and REO percentage chart to reflect the current numbers (Update, This is incorrect my stats didn't reflect the recent changes incorporated in the site I use). Looking at current closings for November we are approximately running 1/3 behind the previous month (no adjustment made for late reporters). The banks and sellers could have rushed to close the deals in October because of the market turmoil and that might have pulled forward closings from the next two months. We also have the holidays starting and demand will be weak just based on seasonality alone.
Pendings also weren't released yet, I will have pendings and Back on Market ratio charts up this weekend.