Showing posts with label shadow inventory. Show all posts

Thursday, January 27, 2011

California Shadow Inventory Report - Q4 - 2010


This is a simple graph to show the accumulation (or lack thereof) of REO inventory. When the blue line is above the green line REO inventory could be accumulating. I say "could be" because the green line is merely the number of homes sold during the quarter that were foreclosed in the past 12 months, so investors trustee flips would be captured in the data as well. I think the blue line will elevate somewhat but the two lines will stay pretty close as it makes little sense to foreclose and not market the home.I am very doubtful of the tsunami theory simply because the government has said it is not what they wish to happen and they have gone to great lengths for it not to happen. What we will have instead is stagnation in the market for a very very long time.

As you can see with the above graph, there was a drawdown in REO inventory in Q4. The net drawdown is about ~2000 homes. Sales were ultra low but homes taken back by the bank were even lower. I am sure this is no coincidence. REO inventory sells very well and the robosigning issue slowing down trustee sales had to have an impact in Q4.

Wednesday, October 27, 2010

California Shadow Inventory Report - Q3 - 2010


This is a simple graph to show the accumulation (or lack thereof) of REO inventory. When the blue line is above the green line REO inventory could be accumulating. I say "could be" because the green line is merely the number of homes sold during the quarter that were foreclosed in the past 12 months, so investors trustee flips would be captured in the data as well. I think the blue line will elevate somewhat but the two lines will stay pretty close as it makes little sense to foreclose and not market the home.I am very doubtful of the tsunami theory simply because the government has said it is not what they wish to happen and they have gone to great lengths for it not to happen. What we will have instead is stagnation in the market for a very very long time.

As you can see with the above graph, there was no great accumulation of REO's during Q3 but the spread between the two lines was at its greatest point in 5 quarters. The accumulation is about ~8000 homes. If resales stay this low and foreclosures stay this high it could be a worrying trend but as prices fall sales will pick up to absorb the excess inventory. And of course the robosigning issue could put a damper on REO supply as well.

Wednesday, August 4, 2010

California Shadow Inventory Report - Q2 - 2010

There was a point in time where various housing bloggers were talking about "shadow inventory" as houses taken back by the bank and purposely kept off the market. According to these bloggers this horde was supposed to be released en masse and flood the market. It was a great, sexy story and I never saw any making much effort to prove or disprove if it was actually happening. Since trustee sales are a matter of public record I went and matched up all trustee's deeds that never made it to the MLS and it turned out to be a trivial sum when you accounted for turnaround time for eviction, trashout, bpo's, and all the other stuff that happens before the houses hit the market. This data was not well received by those bloggers espousing that version of the shadow inventory opinion but they have since changed their tone to the "other" version of shadow inventory. The other housing bloggers talk about "shadow inventory" in the terms of number of delinquent borrowers... this is a very very large number. But in terms of houses foreclosed but not on the market, it is very small. In short, If there is going to be a tsunami that floods the market it will be trivial to see coming before it hits.


This is a simple graph to show the accumulation (or lack thereof) of REO inventory. When the blue line is above the green line REO inventory could be accumulating. I say "could be" because the green line is merely the number of homes sold during the quarter that were foreclosed in the past 12 months, so investors trustee flips would be captured in the data as well. I think the blue line will elevate somewhat but the two lines will stay pretty close as it makes little sense to foreclose and not market the home.

I am very doubtful of the tsunami theory simply because the government has said it is not what they wish to happen and they have gone to great lengths for it not to happen. What we will have instead is stagnation in the market for a very very long time.

As you can see with the above graph, there was no great accumulation of REO's during Q2.

Wednesday, April 21, 2010

California Shadow Inventory Report - Q1 - 2010

There was a point in time where various housing bloggers were talking about "shadow inventory" as houses taken back by the bank and purposely kept off the market. According to these bloggers this horde was supposed to be released en masse and flood the market. It was a great, sexy story and I never saw any making much effort to prove or disprove if it was actually happening. Since trustee sales are a matter of public record I went and matched up all trustee's deeds that never made it to the MLS and it turned out to be a trivial sum when you accounted for turnaround time for eviction, trashout, bpo's, and all the other stuff that happens before the houses hit the market. This data was not well received by those bloggers espousing that version of the shadow inventory opinion but they have since changed their tone to the "other" version of shadow inventory. The other housing bloggers talk about "shadow inventory" in the terms of number of delinquent borrowers... this is a very very large number. But in terms of houses foreclosed but not on the market, it is very small. In short, If there is going to be a tsunami that floods the market it will be trivial to see coming before it hits.

This is a simple graph to show the accumulation (or lack thereof) of REO inventory. When the blue line is above the green line REO inventory could be accumulating. I say "could be" because the green line is merely the number of homes sold during the quarter that were foreclosed in the past 12 months, so investors trustee flips would be captured in the data as well. I think the blue line will elevate somewhat but the two lines will stay pretty close as it makes little sense to foreclose and not market the home.

I am very doubtful of the tsunami theory simply because the government has said it is not what they wish to happen and they have gone to great lengths for it not to happen. What we will have instead is stagnation in the market for a very very long time. I have been assured by people much smarter than I that this is "better". It very well could be better for some but it is worse for others and this choosing of who wins and who loses is fine if you win and a kick in the nuts if you lose. One can guess which side I am on.

Tuesday, October 20, 2009

DQ Foreclosure report and California Shadow Inventory

Dataquick reported on California foreclosures and defaults today in their press release. The above graphic is basically a rebuttal against the believers that there are a large amount of homes already taken back by the bank sitting on the sidelines. Basically when the green line is above the blue line REO inventory is dropping and when the blue line is above the green line REO inventory is rising.

DQ jumped on trying to determine shadow inventory bandwagon as well with this quote:
Of the homes foreclosed on statewide in an 18-month period ending this July, about 82 percent have re-sold on the open market, while 18 percent, or more than 57,000 homes, have not. Of those that have not re-sold, it cannot be determined from public records what portion is currently being marketed for sale, as opposed to, among other things, being used as rentals or being left vacant and not for sale. Over the past year California buyers have snapped up an average of nearly 18,000 foreclosure resales a month.

Now 57,000 might sound like a lot but shadow inventory is about what isn't currently on the MLS being marketed and if it averages a month or two to turn around the home after trustee sale (call it 45 days) you can assume about half of those are on the MLS (either active, contingent, pending, closed but not yet recorded) and the other half are mostly in the pre-list phase. Meaning less than a month and a half of inventory at current absorption rates sitting on the sidelines yet to be marketed. Certainly not a flood waiting to be unleashed. Shadow inventory is the massive amount of homeowner in default not being foreclosed on.. it is NOT a bunch of foreclosed homes yet to be marketed.

You can read the DQ press release here.

Sunday, August 30, 2009

"Postponing the day of Reckoning"

Note: Fixed broken Wiki link.

An article by American Banker showing how the banks are foreclosing on as few properties as possible in a desperate hope to not realize losses right now. This article is a must read (free registration may be required). A classic prisoner's dilemma is forming. As the old saying goes, "Don't panic. But if you do panic, panic first".

From the article (emphasis added):

Pick up just about any city's newspaper or turn on any news show, and if the topic is real estate, the banking industry is likely being lambasted for foreclosing on troubled homeowners.

But industry data and anecdotal evidence suggest banks and servicers have been dragging out the process — not rushing to kick people out of their homes
...
"The goal is to hold off on foreclosures and take losses as slowly as possible to keep balance sheets up,"
...
The foreclosure process — and it is a process — now takes, on average, 18 months to two years, up from 15 months a year ago...plenty of signs indicate that the mortgage companies themselves are in no hurry to seize their collateral.
...
"There are borrowers who are six or eight months in default; they may have exhausted their workout options; but they're put on a forbearance plan because it's an interim to a final resolution, which is foreclosure," he said. "Banks don't want to take the losses now."
...
"Banks are believed to be carrying a lot of loans at accounting levels well above their true market value," he said. "But once a property goes into foreclosure, their options have disappeared."
...
"we do not believe that prices are actually improving for any part of the housing market, except possibly certain foreclosure markets due to a shortage of foreclosed inventory from the recent drop-off in liquidations. … This drop-off has nothing to do with fewer people becoming delinquent. … Instead, it has to do with banks and servicers reducing the rate at which they take back the properties."
...
banks now see an advantage in modifying instead of foreclosing "because it cures the delinquency and they may get par value out of the loan, if property values are stable. Even if they get [only] a few payments, if property values go up, they could do a bit better once they take out the borrower."

Oh what a tangled web we weave...

Thursday, August 20, 2009

Bursting the bubble: Shadow Inventory does not exist.

I see the constant murmur regarding shadow inventory, Doctor Housing bubble referenced it today and you see it on many blogs and message boards. The idea that the banks have foreclosed on a massive swath of the population but due to accounting tricks and/or political pressure they won't put that inventory on the market. It's a great, sexy story, easy to believe and relatively hard to prove so people jump all over it. The biggest problem is it isn't really true. Now before you think I have lost my mind let me clearly define shadow inventory once again... Inventory that the banks have taken possession of but is not on the market.

To understand the current foreclosure inventory situation you have to know how the post foreclosure process works. Once a home is foreclosed the bank will assign it to either an asset management company or even just an individual agent to get it ready for sale. The initial step is determining occupancy and getting the occupant removed and taking possession. If vacant this step doesn't take much time at all. If owner occupied and the owner doesn't want to leave then they have to go through the eviction process. If it is tenant occupied then they get at least 90 days and then if they don't leave they have to go through the eviction process. After possession is gained the house gets cleaned up for sale ("trashed out") and then priced (usually by several different BPO's being done) and finally put on market. So as you can see this will take a bit of time and at any one moment there is a "float" of homes in the pre-list stage getting these steps done. These homes aren't being withheld for any sinister reason they just haven't got ready to go onto market yet.

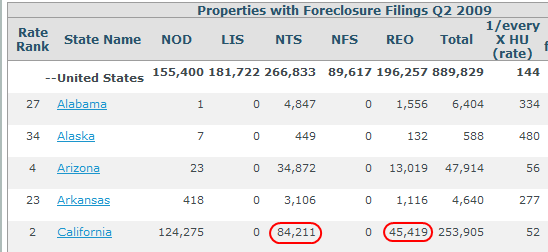
The other concept that the shadow inventory crowd needs to learn is absorption rate of homes. Doctor Housing Bubble had this graphic from the RealtyTrac report showing that shadow inventory is a huge problem waiting to engulf us all:


45,419! That's a lot... wait.. or is it? What is the context of that number relative to the number of sales. For Q2-2009 there were 121,185 homes sold in California. So that represents a little more than a third of sales. Looking at REO resales (meaning it has been taken back by the bank and then sold via auction, MLS, whatever) vs trustee sales we actually see that REO resales have been above trustee sales since the fourth quarter of 2008. REO inventory is dropping, not climbing. The net difference between REO resales and Trustee sales since the beginning of 2008 is around 30,500 homes, about a months to a month and half supply at current REO absorption rate. This number can easily be explained as mostly homes in the pre-list stage getting readied for sale.


Foreclosures are a matter of public record.. so anyone wanting to prove that shadow inventory exists should easily be able to do so. Every once and awhile you will see a REO come on the MLS and it was foreclosed on over 6 months ago (so I consider that shadow inventory) but the numbers are very small. I've searched public records and MLS data extensively to try to quantify the number of foreclosed homes sitting on the sidelines ready to come on as supply. The numbers have not been encouraging. If you give the bank/servicers any sort of realistic "float" period the homes not on market but foreclosed on becomes extremely marginal.

This is a long way of saying if you want to know how much foreclosure inventory is coming on market soon just check the monthly foreclosure reports.. the banks are basically keeping the homes flowing as fast as they can once they foreclose.

Once you accept there is no huge amount of shadow inventory already foreclosed on it brings you to the real shadow inventory. All those homes in default but not foreclosed on.. or possibly not even in the foreclosure process. Matt Padilla over at the Mortgage Insider has the following graphic:

This is the real shadow inventory.. huge swaths of homeowners in default many of which the banks haven't even put in the foreclosure process! You see ever increasing number of borrowers in default... increasing number of people in the foreclosure process... yet the percentage of people foreclosed on is dropping. This is the tremendous amount of political pressure being applied to the servicers and banks to modify loans instead of foreclose. If anyone ever argues the banks aren't doing anything for homeowners just show them this graph.

But just as there a concept of effective demand, that it isn't enough to want to buy you have to have the means in which to make the transaction happen, there is also effective supply. The banks or homeowners may want to sell but can't. The banks can't because of massive political pressure and the homeowners can't because they are underwater. The homeowner stops paying and the banks can't do anything about it. Everyone keeps waiting for this wave to break but it is the stated policy of the United States Government that they do not want that to happen. The USG has been winning that fight so far and there is no indication of them shifting their position anytime soon.

For more on foreclosure wave that may never break I highly recommend Sean O'Toole's "Waiting to catch a wave? Surge of REO listings is unlikely." post.

Monday, August 3, 2009

Ventura County Shadow Inventory quicky.

I was able to check 690 homes against the Ventura County Regional Data share, these homes went back to the bank between January 1st and April 30th of this year.

I was checking to see of the 690 homes how many were Active, Pending, Contingent or Sold during this period after being taken back by the bank.

There were 473 entries listed out of the 690 APN's entered. Or about 68.5% homes that have been put up for sale. This doesn't include homes that might have been put up on other MLS and could possibly include double counts if people were flipping. I think 70% would be a conservative count and that would mean there were 200 more homes waiting in the wings from the first four months of this year. That would equate to about 25% of one months sales in Ventura County.

I still don't feel that there is more than, at most, a couple months of "shadow inventory" waiting in the wings that are bank owned outside of the homes foreclosed the last couple months (which could be considered to be still in the pre-list stage) and I don't feel this is a huge issue that will overwhelm the market. In fact I think the banks would do very well listing any shadow inventory now as the market is clearly starved for inventory and buyers are unable to push their purchasing power.

I will endeavor to quantify the issue further, possibly by looking at the issue on a city by city basis to make the process more manageable.