I saw over on Mathew Padilla's blog that the California Department of Corporations has the results of a survey they take of loan servicers. One of the interesting statistics that matches what I am seeing in the local data is the increase in short sales that lenders are agreeing to. I think this will be the biggest growth segment of the market over the next few years as the majority of servicers work on loan modifications that adjust mortgage rates but few do loan modifications that reduce the principal balance. If the balance isn't reduced there is no way to get out from under the home except appreciation (unlikely anytime soon), short sale or foreclosure. If houses did magically start to appreciate the servicers will see the gain, not the borrower as a result of them not reducing principal balance. The possibility of selling the loan to TARP or on the secondary market is the reason I think few will reduce principal for the borrower.
In January of the the servicers surveyed only 5.69% (974) of completed workouts were short sales. By September that grew to 13.41% (3,732) of completed workouts. Reductions in principal were 0.08% (14) in January and 0.28% (79) in September. Reducing the interest rate at or below the initial/start rate was the most likely outcome for borrowers in January this represented 19.44% (3,327) and 20.36% (5,666) in September. One of the reasons why I don't think the Alt-A resets will be as big of a deal as some might think is how much latitude servicers have in dealing with rate reset issues. It is a far bigger deal for the borrower as to the type of loan they have than if the rate is resetting sometime this year or next. An Alt-A or subprime borrower is screwed because of the issues inherent in the loan and the marketplace much more than any rate reset potential.
The new FDIC plan being rumored to be unveiled is basically a standardized version of the rate reduction (usually for 5 years) for borrowers in default. There is a possibility of principal reduction under the plan but as we see from the above statistics, it is the road less traveled. I think it will do little to help the situation over the long term but may relieve some pressure over the short term.
Thursday, October 30, 2008


Sunday, October 26, 2008
Weekly Active/Pending counts SFV & Ventura - 10/26/08
I'm going to post the weekly inventory counts for Ventura County and the San Fernando Valley as more time goes by this data set will become more useful.
San Fernando Valley:
SFH
Active 4412
Backup 414
Pending 1417
Condo
Active 1516
Backup119
Pending 423
Ventura County:
SFH
Active 2571
Contingent 587
Pending 730
Release from Showing 317
Condo
Active 810
Contingent 184
Pending 255
Release from Showing 74
San Fernando Valley:
SFH
Active 4412
Backup 414
Pending 1417
Condo
Active 1516
Backup119
Pending 423
Ventura County:
SFH
Active 2571
Contingent 587
Pending 730
Release from Showing 317
Condo
Active 810
Contingent 184
Pending 255
Release from Showing 74
Friday, October 24, 2008
San Fernando Valley September 2008 home sales report


Septembers sales report is out for the San Fernando Valley. SFH sales came in at 658, down 1.20% from the month before and up 81.77% from the same month a year earlier. This "strength" in sales comes as median price fell to $392,500, down 7.65% from the month before and down 37.07% from the same month a year earlier. Last year at this time the full force of Countrywide and all other lenders switching over from a Wall Street model to a Fannie/Freddie/FHA model hit the market. Fannie and Freddie still had ultra loose guidelines and stated income available at that time. This is what ground sales to there lowest levels in history. Now with prices dramatically falling the best the market can muster is a month which is the third weakest showing for September in history.

 Condo sales came in at 211, up 22.67% from the previous month and up 36.12% from the year before. Median price for condos fell 5.45% from the month before and are down 33.33% from the year before period. One thing to remember about condo supply is that it has greatly increased in the boom years and it will be hard to match the sales low of the 90's.
Total Pendings for September are at 1,305, their strongest month of the year. See my previous post regarding the large amount of fallout in the market as to why this might not be as strong of a sign as it would be in normal times. I think the elimination of FHA seller assisted down payment on Oct 1st (one of the last bastions of 100% financing) and all major mortgage insurers backing away from California financing greater than 90% will start affecting sales after this month (people still have locks on old loans and can close under the looser guidelines until those expire). I haven't even mentioned the local and national economic turmoil which is another issue entirely.
I'll give a forecast for October sales on November 2nd and will update pendings and inventory this weekend.
Back on Market..

I'm still struggling with the best way to represent that amount of homes falling out of escrow. The above graph represents the current months Back On Markets (BOM) divided by the average of the previous 3 months pendings. The number of properties going pending in September was the strongest month this year at 1305, no sign of a seasonal slowdown in that regard. This months number of BOM was also the largest number this year at 440. While we have seen an increase in pendings sequentially every month this year this hasn't translated directly into an increase in sales each month. It is looking like the fallout is winning the war.
If a seasonal slowdown does come the fallout ratio will spike and sales will fall even more dramatically than normal. If the seasonal slowdown doesn't come then one of two things will be happening 1) Housing is in recovery mode, not likely, but you'll be able to tell if this is true by watching prices firm up or 2) The lenders have stayed motivated to move inventory during the fall/winter months and you will see if this is true by watching prices plummet.
Update:
 Here is the BOM as a percentage of the current months pendings (blue line) and as a percentage of the previous months pendings (red line).
 Here is a chart of sales (orange) , pendings (green) and BOM (purple) over time.
Wednesday, October 22, 2008
Short Sale & Foreclosure for San Fernando Valley & Ventura County
Here are short sales and foreclosures as a percentage of total sales for 2008.
San Fernando Valley:

Ventura County:

The REO flag appeared later in 2008 for Ventura so that is why you see the lack of REO sales being tracked early on. I think many agents weren't setting some of these flags and some of what you see isn't a natural progression of the market but more of an education of listing agents. Official DQ foreclosure numbers should be out this next week and we'll get a better feel for these types of things. As you can see though short sales are becoming a significant force in the market. As servicers improve their procedures and work to move inventory sooner rather than later I think short sales will become an even greater force.
San Fernando Valley:

Ventura County:

The REO flag appeared later in 2008 for Ventura so that is why you see the lack of REO sales being tracked early on. I think many agents weren't setting some of these flags and some of what you see isn't a natural progression of the market but more of an education of listing agents. Official DQ foreclosure numbers should be out this next week and we'll get a better feel for these types of things. As you can see though short sales are becoming a significant force in the market. As servicers improve their procedures and work to move inventory sooner rather than later I think short sales will become an even greater force.
Monday, October 20, 2008
Ventura County September 2008 Sales


September 2008 sales were 808 which is a 4.9% decrease from the previous month and increased 38.8% from September 2007. Median price was $385,000 down $15,000 (3.75%) from the previous month and down $160,500 (29.4%) from the previous year. This was the second worst September on record the "dramatic" sales increase is just in comparison to the span from September '07 to March '08 where the mortgage credit bubble popped and people had to start proving income. This caused a tremendous vacuum where sales dropped to never seen before levels and inventory climbed. We are now still in the adjustment period with prices, inventory and sales are struggling to find an equilibrium. Next spring season we should see slightly improved sales (March will be much better but the rest of the year shouldn't really knock peoples socks off), inventory should drop down to slightly elevated levels instead of the current high levels and prices will continue to fall.

I was relatively optimistic that 2009 could get very close to the bottom (close enough for those thinking to buy) as far as prices in Ventura. But with the passage of S.B. 1137 and delay it will cause foreclosures to come onto the market I think that will push off the "close enough" bottom to 2010 and the absolute bottom a couple years after that. Foreclosures and short sales will still drive the market but some of the pressure is relieved. I think the foreclosure peak is behind us, servicers will use this respite to perform triage and mod as many loans as they can get away with. Those that can't be saved will be allowed to short sale and if they refuse to work with the servicer, then foreclosed. This is merely my opinion and is backed up with no hard facts. I have heard some chatter regarding servicers (particularly Countrywide) working on an en masse mod program to be rolled out in December. Other servicers are working to get the option-arm reset loans off their books to mitigate that issue. Short sales will have the same pressure on the market as foreclosures but it won't show up in the official foreclosure numbers. This is one of the reasons why I think the foreclosure peak has passed, the servicers recognize that delaying the inevitable just will net them less. I am just not sure if borrowers will go the Short Sale route or choose the low-interest or principal reduction mod and that is why I am less optimistic as to next years sales being much higher or prices dropping as much as they have (percentage wise) in the last year.
Weekly Active/Pending counts SFV & Ventura - 10/19/08
I'm going to post the weekly inventory counts for Ventura County and the San Fernando Valley as more time goes by this data set will become more useful.
San Fernando Valley:
SFH
Active 4416
Backup 385
Pending 1469
Condo
Active 1504
Backup 114
Pending 421
Ventura County:
SFH
Active 2580
Contingent 577
Pending 730
Release from Showing 313
Condo
Active 814
Contingent 181
Pending 253
Release from Showing 79
San Fernando Valley:
SFH
Active 4416
Backup 385
Pending 1469
Condo
Active 1504
Backup 114
Pending 421
Ventura County:
SFH
Active 2580
Contingent 577
Pending 730
Release from Showing 313
Condo
Active 814
Contingent 181
Pending 253
Release from Showing 79
Thursday, October 9, 2008
San Fernando Valley September sales estimates


I'm a little late calculating my preliminary SFV numbers this month, SFH sales currently stand at 676 and a median of $399,000. Condo sales are 225 and median was $250,000, I think there is something up with that median though and using an estimate based on the average price I used $265,000 for the graph. Sales are up both MoM and YoY and prices were down MoM and YoY. Last year at this time the subprime and Alt-A markets abruptly disappeared and the market was left with Fannie/Freddie and FHA and that accounted for such a historic low in sales. Now that prices have fallen sales will look dramatically better when comparing YoY numbers but as you can see from the graphs they are very low historically. So when you hear how great the market is you can keep in mind the historic context and see that the market is still very sick and major price declines continue.
Wednesday, October 8, 2008
More credit tightening..
Here is a list of changes that either went into effect since October 1st or going to soon go into effect:
- Seller Funded Down Payment Assistance no longer allowed for FHA Loans - This removed one of the last widely available avenues of now down payment loans for borrowers. Effective October 1st.
- All major private mortgage insurers no longer allow above 90% LTV - This moved the bar from 5% down to 10% for Fannie/Freddie loans. Vast majority went into effect in October or before. Last holdout goes into effect in November. This isn't nationwide but California and Florida specific.
- Conforming Jumbo limit dropping to 625k from 729k - Effective January 1st with money so tight I think this will really affect the 800k-1,000k homes. The guidelines on super jumbos are just much tighter on borrowers and the rates are very expensive.
- Income waivers are becoming very hard to get - Brokers were using income waivers as a backdoor stated income loan. The Fannie/Freddie underwriting engines would give waivers for documenting incomes if the borrower had a good credit score and a little down. These engines were updated this last week and income documentation waivers are now very hard to come by. It is becoming a full doc world.
I would expect the market to start to weaken even above normal seasonality in about 45 days as old loan locks are lost and new borrowers are subjected to the newer guidelines. That said the market is still a "good" one, a well priced home (at or slightly under market) in the sub $600,000 range will be gone in a week. The mortgage market is still very liquid because of the Feds actions, it is just becoming much more a vanilla loan market. I would still expect the final quarter of this year to handily beat last years 4th quarter. This has more to do with the just how historic the sales declines were last year around this time and the massive price declines that have happened since then than any strength or recovery signs in the current market.
Monday, October 6, 2008
What loans are in danger of going away?
Here is a modified July 2008 Ventura County LTV chart:

Click to enlarge
The pink line represents the new conforming limit on January 1st 2009. These "super conforming" loans represent a lowering of the conforming jumbo limits by $104,000, the loans above this line represent the new jumbo limits and these loans will have higher credit standards, much higher rates and fees. I think these loans will essentially be eliminated and supply will have to fall under the pink line in order for it to see any effective demand.
The green area represents Mortgage Insurance territory and the blue dots (non-FHA/VA) will be the items affected here. Most mortgage insurers have announced guidelines that limit their loans in California to the conforming limit of $417,000 and 90% max LTV. Demand in this area will either have to be met through FHA or be eliminated if the property or borrower doesn't meet FHA guidelines.
It is clear there are more headwinds coming for the mortgage market. The government has done everything possible to keep it as liquid and functioning as it can but credit is still contracting. Even though falling prices can help meet demand, prices alone aren't a panacea. The demand in the green square if unable to get insurance must be met by saving more money for a down payment or choosing a much cheaper home.
Update: I've looked at the top Mortgage Insurers guideline and I don't see a single one who will lend over 90% LTV in Los Angeles or Ventura County. This includes United Guaranty (p.29), MGIC (p.8), Genworth, RMIC and PMI. The area in the graphic above in the green shade is definitely in trouble.
Sunday, October 5, 2008
Ventura County June & July 2008 down payment size


Here is the scatter charts for Ventura County for June and July. Clearly FHA is gaining in popularity and taking over market share. The loans "at risk" for tightening are the blue dots between 80% and 100% LTV these are the ones affected by mortgage insurers guideline changes. The one issue affecting FHA is seller funded down payment assistance went away October 1st and was very popular. The mortgage insurers are still tightening especially in the main bubble markets like Florida and California.
Wednesday, September 24, 2008
Ventura County August 2008 Sales

 August sales dropped 2.2% from the previous month with the median price declining $20,000, or 4.7% from the previous month. Comparing to the year before, a time of the lowest sales since Dataquick has been recording sales for Ventura, sales increased 7.7% and the median price declined 30.4%. We are passed the point of peak inventory and passed the low point in sales. From here on out it will just be sales muddling through as prices continue to decline. If the loan servicers get motivated we should see a flattening of sales (at the cost of price) instead of a steep seasonal drop off. I think the servicers will stay motivated but government intervention is constantly looming and I think some are trying to hold off the recognition of losses as long as possible.
Monday, September 22, 2008
San Fernando Valley August 2008 sales charts


I don't see the official stats released on the SRAR site but a friend emailed me the official stats for August.
August official sales stats are out for the San Fernando Valley. SFH sales came in at 666 which was a 7.11% decline MoM and 20.65% improvement YoY. SFH median was $425,000 which was a 2.3 % decline MoM and 34.11% decline YoY. My guesstimates were ~700 for SFH sales, off about 5%. 2 months in a row I estimated 5% too high for preliminary sales, next month I will use 10% instead of 15% for my initial estimates.


Condo sales came in at 172 which was 16.1% decline MoM and -8.5% decline YoY. The median price Condo for July was $275,0000 off 1.8% MoM and down 29.3% YoY. My guess was ~176 sales for Condos which is getting pretty close. Condos continues to perform horribly.
Since the rest of the stats haven't been released I don't have pendings, I will update this post when I get official numbers.
Tuesday, September 16, 2008
CAR 2009 Forecast

As far as I know the 2009 forecast wasn't supposed to be released until October. But here is a sneak peak released a bit earlier.
I think the CAR doesn't have any data models or anything sophisticated they just forecast sales and prices +/- 5% and then adjust throughout the year based on incoming data.
Tuesday, September 2, 2008
Initial San Fernando Valley readings.
Here are the initial readings for the San Fernando Valley for August. Late reporters will bring the sold numbers higher, it is an estimate but I predict the numbers will increase about 15%.
Current Single Family Home sales (estimate):
611 (* 1.15 = ~700 sales)
188 Flagged as REO
93 Flagged as Short Sale
374 Flagged as Vacant (can include Short Sale or REO)
Current sold Single Family Home median price:
$426,500
Current Condo sales (estimate):
153 (*1.15 = ~176 sales)
48 Flagged as REO
24 Flagged as Short Sale
107 Flagged as Vacant (can include REO or Short Sale properties)
Current sold Condo median price:
$270,000
These readings are basically flat from the previous month, Pending sales are currently at 950 for condos & SFH and backup offers are at 336.
Current Single Family Home sales (estimate):
611 (* 1.15 = ~700 sales)
188 Flagged as REO
93 Flagged as Short Sale
374 Flagged as Vacant (can include Short Sale or REO)
Current sold Single Family Home median price:
$426,500
Current Condo sales (estimate):
153 (*1.15 = ~176 sales)
48 Flagged as REO
24 Flagged as Short Sale
107 Flagged as Vacant (can include REO or Short Sale properties)
Current sold Condo median price:
$270,000
These readings are basically flat from the previous month, Pending sales are currently at 950 for condos & SFH and backup offers are at 336.
Inventory stands at 6,646. SFH inventory is 4,957 of which 2,299 has Short Sale or REO flag set and an 1,426 vacant but some REO and Short sale inventory is in there.. Condo inventory is 1,689 of which 877 has the Short Sale or REO flag set and 748 have the vacant flag set. I had all the vacants parsed out from the REO and Short sale but a couple of the numbers looked off so I just reported all the vacants instead. There are definitely some vacants that are REO but do not have the REO flag set. I think it is safe to say that the majority of inventory is made up of motivated/distressed sellers.
I'll update the graphs when the numbers become official. Until then here is a few potpourri items to read over:
Chinese Banks Cut Fannie, Freddie Debt: Foreign investment has kept mortgage rates low. Now some foreign investors are backing away. A bad economy could still keep rates low but would be bad for the housing market.
Preliminary 2009-2013 Mortgage Volume Forecasts: iEmergent is predicting a 4% drop in purchase volume for 2009.
MBA mortgage delinquency survey comes out Friday, it should be a doozy.
Thursday, August 28, 2008
CAR 2008 updated forecast, Round 4
Original: 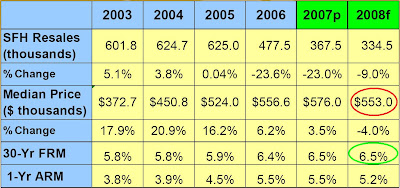
Updated in April 2008:
Updated in June 2008:
Update August 2008:

(Click to enlarge)
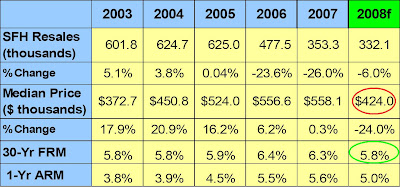
A new California Association of REALTOR® forecast has been posted. You will notice they increased the number of sales by 53,300 since their previous forecast 2 months before. The C.A.R. also expects the median price to come in at $27,000 below their previous forecast and $178,000 below their original forecast. You'll notice the "e" next to 2008, this is now an estimate not a forecast. Let's hope their estimates are better than their forecast.

Updated in April 2008:

Updated in June 2008:

Update August 2008:

(Click to enlarge)
A new California Association of REALTOR® forecast has been posted. You will notice they increased the number of sales by 53,300 since their previous forecast 2 months before. The C.A.R. also expects the median price to come in at $27,000 below their previous forecast and $178,000 below their original forecast. You'll notice the "e" next to 2008, this is now an estimate not a forecast. Let's hope their estimates are better than their forecast.
Wednesday, August 27, 2008
Fannie/Freddie slowing down purchases. FHA increasing fees.
In case anyone is thinking mortgage credit contraction is over, from the WSJ (emphasis added):
The GSE can shrink by lowering its purchases below the amount loans in its portfolio get paid off. I don't know what that level of purchases is currently but at the very least they appear to be planning to grow more slowly. I'm sure we will see additional guideline tightening in the near future. I think Freddie Mac is overdue for a tightening based on the guidelines I've read and what I've seen on the broker boards.
So if Fannie/Freddie aren't going to save housing I guess FHA will, except they are raising fees:
The FHA tried to make the increase risk-based but Congress stopped them in the new housing bill. So they just increased the rate for everyone. The biggest issue with FHA is that they are only insurance, someone else (Fannie/Freddie, Ginne, or the FHLB) would have to take the loans off the lenders hands in order for them to make more loans. Ginnie Mae has started becoming more aggressive in getting FHA loans securitized but the slowdown with Fannie/Freddie and FHA increasing fees is a significant development.
In their latest monthly reports, Fannie and Freddie disclosed that they cut back on commitments to buy mortgage securities in July. Those purchase commitments, net of planned sales, totaled about $16.3 billion, down from $55.1 billion in June. The companies are providing less support to the mortgage market, while reducing their capital needs.
Fannie increased its holdings of "liquid" investments, cash and short-term securities that can easily be sold, to $103.6 billion, up 43% from June. The move gives the company more flexibility to reduce its future borrowings if market conditions worsen, company officials said.
The GSE can shrink by lowering its purchases below the amount loans in its portfolio get paid off. I don't know what that level of purchases is currently but at the very least they appear to be planning to grow more slowly. I'm sure we will see additional guideline tightening in the near future. I think Freddie Mac is overdue for a tightening based on the guidelines I've read and what I've seen on the broker boards.
So if Fannie/Freddie aren't going to save housing I guess FHA will, except they are raising fees:
In a posting on its Web site Tuesday, the FHA said the upfront premiums charged to most borrowers will be 1.75% of the loan amount, effective Oct. 1. That is up from the 1.5% that was in effect until July 14, when the FHA adopted a "risk-based" pricing system that created a range of charges depending on borrowers' credit scores and the amount of the down payment or equity they owned in the home.
The FHA tried to make the increase risk-based but Congress stopped them in the new housing bill. So they just increased the rate for everyone. The biggest issue with FHA is that they are only insurance, someone else (Fannie/Freddie, Ginne, or the FHLB) would have to take the loans off the lenders hands in order for them to make more loans. Ginnie Mae has started becoming more aggressive in getting FHA loans securitized but the slowdown with Fannie/Freddie and FHA increasing fees is a significant development.
Monday, August 25, 2008
Fallout.

This is the Back On Market ratio compared to the previous 3 month average pendings. There is clearly a high amount of fallout happening and I think once offers slow even a little we will see sales fall faster than normal. I think the high amount of fallout is for many reasons, the moving target that is today's mortgage market, the lack of quality of the inventory on the market (more likely to find inspection issues), the number of POORLY managed short sales on the market (many agents are in a "let's throw it up on the market and see what sticks" mood, it's either laziness or inexperience). I tried getting data before February 2007 since that is where my data ends and I have an inkling that the fallout ratio for the few years before that was in the sub 20% range. Finacing fallout was much less due to the ability to qualify anyone so you are left with personal and inspection reasons for the deal falling apart. The few data points I could find support this 20% fallout thesis but I don't have enough for it to be cut and dried.
Jim the Realtor has seen the same thing with his REO listings (all in multiple offer situations) in his San Diego market and his comment is, "And it's only going to get tougher the next few months." I agree wholeheartedly.
Saturday, August 23, 2008
San Fernando Valley July 2008 sales charts


July official sales stats are out for the San Fernando Valley. SFH sales came in at 717 which was a 6.86% improvement MoM and 16.21% improvement YoY. SFH median was $435,000 which was a 0.9 % improvement MoM and -30.95% decline YoY. My guesstimates were between 750-760 for SFH sales, off about 5% and $435,000 for median (off 0%).


Condo sales came in at 205 which was -10.8% decline MoM and -25.7% decline YoY. The median price Condo for July was $280,0000 off -5.0% MoM and -31.2% YoY. My guess was 195-200 for Condos (off about 3%) and $270,000 for median (off about 3.5%).
Pending sales for both SFH & Condos came in at 1141 right in between my last months estimate. SFH sales should be flat MoM next month and as we come into the easy YoY comparisons should be up dramatically YoY. For Condos they are continuing the perform horribly and but should still be flat to slightly higher YoY due to how far sales of everything fell off after July of last year.
I think I'm on the right track as far as estimates go so I'll have a market check around the first to give you a preview on the August numbers. If anyone needs any SFV submarkets broken out let me know in the comments or by email.
In looking at the data further I think once the traditional sales season ends sales will drop faster than normal, I will detail my reasoning for this in a post later next week. I think 2008 SFH sales will beat 2007 SFH sales but condo sales won't. The signals are mixing now for sales which is indicative of a market shift but prices are still firmly in a downward trend.
Tuesday, August 19, 2008
Ventura County July 2008 Sales


July continued the upward trend in sales rising 13.4% MoM and 10.9% YoY. From here forward each month should show positive YoY gains. As you can see in the top graph, once Alt-A blew up the music stopped in the housing market and everyone was looking around for a chair. The tremendously slow sales during that historic lull means that the yearly sales comparisons will be easy. If you look at the sales in historic context they still are very low but it is clear that the sales bottom has been reached in Ventura County and now it's just a question of how far prices will drop. If the banks stay motivated through the winter and the economy muddles through we could even have "ok" sales (10% off average for any particular month) next year at significantly discounted prices. I was thinking that July was probably the peak because of the rate jump in June pulling demand forward. But looking at some forward looking stats I think some areas will hit higher highs than July, in the aggregate it will be close to see if August can beat July, but it is certainly a distinct possibility. There is also significant of fallout of pending transactions so predictions are really tough.
Tuesday, August 12, 2008
Guesstimates of July SFV sales
Update: Looks like DQ won't be releasing until next week. The Ventura charts will be released then.
I'm working on getting a running total of SFV sales and pendings going, the first step will be to see if I'm even in the ballpark. The current sales for July according to my calculations is 744 for SFH homes with a $435,000 median. For condos sales are around 190 with a $270,000 median. Late reporters should increase both these numbers so I think the final tally will be in the 750-760 ballpark for SFH and 195-200 area for condos.
This would represent a increase of 10.8% MOM and 20.5% YoY for SFH sales and a decrease of 17.3% MoM and 31.1% YoY for condo sales. Active inventory is basically flat (slightly up) and pendings are either between 1060 and 1170 depending on various factors, this brackets last months pendings of 1128. Sales should be positive for the SFV through the rest of the year, the YoY comparisons are very easy. Something catastrophic will have to happen for that not to be the case.
We will see how things look once the official numbers come out then I can fine tune my efforts a bit better. Once I have that dialed in I can have running totals down to the city level if people are interested. I will also work at defining the short sale and REO market versus the rest of the market.
Here are the charts as things stand with the above numbers.
SFH sales:

July only SFH sales:

Condo sales:
I'm working on getting a running total of SFV sales and pendings going, the first step will be to see if I'm even in the ballpark. The current sales for July according to my calculations is 744 for SFH homes with a $435,000 median. For condos sales are around 190 with a $270,000 median. Late reporters should increase both these numbers so I think the final tally will be in the 750-760 ballpark for SFH and 195-200 area for condos.
This would represent a increase of 10.8% MOM and 20.5% YoY for SFH sales and a decrease of 17.3% MoM and 31.1% YoY for condo sales. Active inventory is basically flat (slightly up) and pendings are either between 1060 and 1170 depending on various factors, this brackets last months pendings of 1128. Sales should be positive for the SFV through the rest of the year, the YoY comparisons are very easy. Something catastrophic will have to happen for that not to be the case.
We will see how things look once the official numbers come out then I can fine tune my efforts a bit better. Once I have that dialed in I can have running totals down to the city level if people are interested. I will also work at defining the short sale and REO market versus the rest of the market.
Here are the charts as things stand with the above numbers.
SFH sales:

July only SFH sales:

Condo sales:

I think DQ numbers should be reported tomorrow, if they are I'll get the Ventura County charts up.
Wednesday, August 6, 2008
Robin hood?
"Little John: You know somethin', Robin. I was just wonderin'. Are we good guys or bad guys? You know, I mean, uh… our robbin' the rich to feed the poor.
Robin Hood: Rob? Tsk tsk tsk. That's a naughty word. We never rob. We just sort of borrow a bit from those who can afford it.
Little John: Borrow? Boy, are we in debt. "-Robin Hood, Disney Animated Film
Fannie Mae announced that they will change their Loan Level Pricing Adjustments (LLPA) and raise their Adverse Market Delivery Charge. The LLPAs are variable depending on the loan FICO and LTV. They raised the fees in some areas and lowered it in others. They Adverse Market Delivery Charge is a flat fee per loan that was raised from .25% to .50%. I will take a crack at a possible explanation for the changes. For background you can look at the charts for purchases displayed in the announcements, here is the old fee structure and here is the new.
What I did was combine the Adverse Market Delivery Charge with the LLPA fees and then took the difference between the results and we get the following:

Robin Hood: Rob? Tsk tsk tsk. That's a naughty word. We never rob. We just sort of borrow a bit from those who can afford it.
Little John: Borrow? Boy, are we in debt. "-Robin Hood, Disney Animated Film
Fannie Mae announced that they will change their Loan Level Pricing Adjustments (LLPA) and raise their Adverse Market Delivery Charge. The LLPAs are variable depending on the loan FICO and LTV. They raised the fees in some areas and lowered it in others. They Adverse Market Delivery Charge is a flat fee per loan that was raised from .25% to .50%. I will take a crack at a possible explanation for the changes. For background you can look at the charts for purchases displayed in the announcements, here is the old fee structure and here is the new.
What I did was combine the Adverse Market Delivery Charge with the LLPA fees and then took the difference between the results and we get the following:

(click to enlarge)
Looking at the last May 2008 LTV chart, I added a shaded area to correspond with the downpayment size getting hit with the most fees.

(click to enlarge)
Loans are very concentrated around this point. Everyone to the left of the pink area gets hit by only a .25% increase, possibly a recognition that these loans are ultra-safe and banks might portfolio them instead of selling them to secondary if the price gets too high/attractive. Everyone to the right (ignore VA and FHA, I don't believe they get assessed these fees) is private mortgage insurance territory. Basically, Fannie isn't putting any more pricing pressure on the MI companies since MI above 90% is getting scarce. They are also trying to limit fees on the more economically sensitive borrowers. Fannie will definitely get flack for raising fees but I'm sure they will point out to their friends in Congress that they are trying to take from the rich, not the poor.
Tuesday, August 5, 2008
MGIC tightens again
Mortgage insurer MGIC updated their guidelines again. Basically they loped off the max LTV for purchases in AZ, CA, FL, NV by 5% and now max out at 90%. I think they won't drop the LTV anymore in the bubble zones but will start restricting DTI's to give themselves more of a cushion and insulate them from the most debt ridden borrowers:

On a different note, I've noticed several flips come on the market lately that originated at either the courthouse foreclosure auction or the REDC type auction. What was interesting about these flips was the purchase price was low enough for an investor to attempt a flip, still have a profit margin and be the lowest priced listing nearby. If the servicers start pushing volume during the fall and winter months things could get interesting. I notice Hudson & Marshall is starting to do some absolute auctions in other states as well. I think July will represent the sales volume peak of 2008 and prices will start accelerating downward again through fall and winter.

On a different note, I've noticed several flips come on the market lately that originated at either the courthouse foreclosure auction or the REDC type auction. What was interesting about these flips was the purchase price was low enough for an investor to attempt a flip, still have a profit margin and be the lowest priced listing nearby. If the servicers start pushing volume during the fall and winter months things could get interesting. I notice Hudson & Marshall is starting to do some absolute auctions in other states as well. I think July will represent the sales volume peak of 2008 and prices will start accelerating downward again through fall and winter.
Tuesday, July 22, 2008
Final June 2008 San Fernando Valley sales charts and DQ Foreclosure chart
Here are the finalized SFV charts for June:


Dataquick's quarterly foreclosure report was released today. I may have more to write about it later but here is an updated chart of the likelihood of being foreclosed on once a notice of default is filed.

Clearly the foreclosure issue is getting worse. L.A. County started down the foreclosure path a bit later than some of the rest of the state so it will peak later as well. I think some parts of the state are near their peak of default activity. According to my calculations Q4 of 2008 should have more homes foreclosed in the state than sold. But there are some safe harbor provisions in the new housing bill that may allow servicers to make wholesale modifications without exposing themselves to investor lawsuits. This may make the foreclosure issue subside faster if homeowners start getting handed sweetheart deals by servicers. I think it is a small possibility but one that has to be taken into account.


Dataquick's quarterly foreclosure report was released today. I may have more to write about it later but here is an updated chart of the likelihood of being foreclosed on once a notice of default is filed.

Clearly the foreclosure issue is getting worse. L.A. County started down the foreclosure path a bit later than some of the rest of the state so it will peak later as well. I think some parts of the state are near their peak of default activity. According to my calculations Q4 of 2008 should have more homes foreclosed in the state than sold. But there are some safe harbor provisions in the new housing bill that may allow servicers to make wholesale modifications without exposing themselves to investor lawsuits. This may make the foreclosure issue subside faster if homeowners start getting handed sweetheart deals by servicers. I think it is a small possibility but one that has to be taken into account.
Down payment assistance gone for FHA with new housing bill
From the Sacramento Bee:
The DPA programs were a source of high defaults for the FHA and represented one of the few paths to 100% LTV financing left in the marketplace. This represents another incremental tightening of credit guidelines that will certainly slow sales at the bottom end of the market but these sales shouldn't have been made to begin with.
A signature Sacramento program that has helped almost 300,000 lower-income people nationally buy homes in the past decade – while stirring controversy for years – is likely to be shut down this week, Nehemiah Corp. of America officials acknowledged Monday.
The nonprofit giant believes Congress and President Bush will ban its decade-old down-payment assistance "gift" program within days as part of a larger housing bill, Nehemiah President and Chief Executive Officer Scott Syphax said Monday.
The DPA programs were a source of high defaults for the FHA and represented one of the few paths to 100% LTV financing left in the marketplace. This represents another incremental tightening of credit guidelines that will certainly slow sales at the bottom end of the market but these sales shouldn't have been made to begin with.
Monday, July 21, 2008
Ventura County May 2008 down payment size
Here is another scatter chart showing what type of loans and down payments were necessary to close a home in Ventura County in May 2008. I broke out the different classes of loans in different colors to help differentiate who was making the higher LTV loans. FHA (which is fighting the down payment assistance loophole) and VA are where it is at in terms of low to no down payment loans. Both are Full doc however so these borrowers do have the cash flow to get qualified.

Most conventional loans about the conforming limit of $417,000 that are in "Conforming Jumbo" territory mostly start at 10% down and more. There are some FHA high LTV loans above the conforming limit as well but these are borrowers with proven income and paying mortgage insurance. By comparing this chart with the earlier September 2006 chart you can see both the depreciation and lack of high LTV high value loans (the nearly solid line of blue at 100% LTV).

Saturday, July 19, 2008
Preliminary June 2008 San Fernando Valley sales charts
Here are the estimated SFH and Condo sales for the SFV region based on the preliminary release from the SRAR.
Homes sales look to be slightly up to around 682, 2-3% MoM and flat to down 1% from the year before. The median should come in around $440,000 which would be down 2% MoM and down around 32% (!) from $655,000 a year before. Pending sales are up slightly so next month should see sales around 700 if my estimates are correct.


Condo sales look to be up around 29% MoM and down 11% YoY. The median should come in around $310,000 which would be up 3% MoM and down 22% YoY. Pendings are flat so next month sales should be close to this months estimated 217 sales.


We are in a bifurcated market. There are the motivated sellers and then there is everyone else. The banks are clearing inventory but not keeping up with the number of homes they are taking back. Inventory is falling a bit and we are starting to go negative YoY. This a function of unrealistic sellers giving up and more homes being foreclosed and waiting around to be processed and put on the market.
As the summer progresses it will be interest to see the course the banks take. If they hold the line on prices during winter, inventory builds. If they try to maintain volume during a traditionally slow time, prices will fall dramatically. Which path they choose to go will set up next years selling season. We could have much better sales year next year if prices go into the selling season significantly lower. But if the banks hold the line sales will probably only have a small rebound as the standoff continues.
Homes sales look to be slightly up to around 682, 2-3% MoM and flat to down 1% from the year before. The median should come in around $440,000 which would be down 2% MoM and down around 32% (!) from $655,000 a year before. Pending sales are up slightly so next month should see sales around 700 if my estimates are correct.


Condo sales look to be up around 29% MoM and down 11% YoY. The median should come in around $310,000 which would be up 3% MoM and down 22% YoY. Pendings are flat so next month sales should be close to this months estimated 217 sales.


We are in a bifurcated market. There are the motivated sellers and then there is everyone else. The banks are clearing inventory but not keeping up with the number of homes they are taking back. Inventory is falling a bit and we are starting to go negative YoY. This a function of unrealistic sellers giving up and more homes being foreclosed and waiting around to be processed and put on the market.
As the summer progresses it will be interest to see the course the banks take. If they hold the line on prices during winter, inventory builds. If they try to maintain volume during a traditionally slow time, prices will fall dramatically. Which path they choose to go will set up next years selling season. We could have much better sales year next year if prices go into the selling season significantly lower. But if the banks hold the line sales will probably only have a small rebound as the standoff continues.
Subscribe to:
Posts (Atom)
